Download
1 / 33
350 likes | 381 Views
Netflow Collection & Processing. David Ripley. David A. J. Ripley MSc., ARCS daripley@indiana.edu. Lead Network Security Developer, Advanced Network Management Laboratory Indiana University Network security infrastructure development and research for the ANML.

E N D
Netflow Collection & Processing • David Ripley
David A. J. RipleyMSc., ARCSdaripley@indiana.edu • Lead Network Security Developer, • Advanced Network Management Laboratory • Indiana University • Network security infrastructure development and research for the ANML. • Background in physics, image processing, satellite remote sensing, system administration.
Overview • What is a “flow”? • What is Netflow specifically? • Netflow collection infrastructure. • Netflow processing, problems and issues
Netflow Recap • Q. What is a flow? • A. In a general sense, a flow is a series of packets with some attribute(s) in common.
Netflow Recap • Common attributes define a flow • Source and/or destination of the traffic. • Protocol - TCP, UDP, ICMP? • Timing - start, end, and duration of the traffic. • Routing information - interfaces, AS, etc.
Netflow Recap • Flows can be unidirectional or bidirectional - the latter adds possible information. • Aggregated flows. • Application flows - classify packets by inspecting their contents • We’re not going to worry too much about these cases.
Netflow Recap • As far as we’re concerned, a flow is a series of packets with the same: • IP Protocol (UDP, TCP, ICMP) • Source and destination ports • Source and destination addresses
Netflow Recap • The recording of a flow is subject to idiosyncrasies of sampling frequency and sampling window • Bucket timeout - systems typically consider one minute windows. • Flows longer than one minute will appear as two flow records • Multiple flows (with the same characteristics) within a single one minute window will appear as a single flow record • Sampling rate • Router will only consider one out of every N packets; N=??? - data loss vs. expensive operations.
An example • Host A gets a web page from Host B • This will show up as two flows (usually) • Host A, port 12345 Host B, port 80 • Host B, port 80 Host A, port 12345
Why Netflow? • What kinds of information can we gather? • What percentage of traffic on the network is web traffic? ssh? IRC? • What is the average transfer rate for network communications? • Who uses the network the most? • Have usage patterns changed over time? • For the Chicago region, how much of the traffic of the region is staying in the region? • Many others
Why Netflow? • Historically, traffic accounting, acceptable use enforcement; • Researchers and engineers needed to answer all kinds of questions about network traffic. • Traffic accounting in the form of flow records provided that information.
Why Netflow? • Traffic Engineering/Accounting • How traffic is shared with competitors; how customers are billed. • Security/Policy monitoring • DoS/DDoS detection • Research • Measuring the growth of networks • Identifying how the network is being used.
What data is there? • It depends. • We keep talking about “flows” - we really mean Cisco’s Version 5 flow records • A Cisco-defined “standard” • Used on Abilene - so that’s what we use.
Netflow Version 5 • Cisco-defined de-facto standard • Efforts are underway in the IETF to make this standard official • Flows are exported as UDP packets • Each packet contains a number of flow records plus a header with information common to these records • Delivery is not guaranteed! • There are sequence numbers so we know how many packets we’ve lost.
Version Count Byte 1 Byte 2 Byte 3 Byte 4 SysUpTime UNIX Seconds (seconds since Epoch) UNIX Nanoseconds (residual nanoseconds) Flow Sequence Number Engine Type Engine ID Reserved Netflow V5 Header
Source IP Address Byte 1 Byte 2 Byte 3 Byte 4 Destination IP Address Next Hop IP Address Input ifIndex Output ifIndex Packets Bytes Start time of flow End time of flow Source port Destination port Padding TCP Flags IP Protocol TOS Source AS Destination AS Source Mask Length Destination Mask Length Padding Netflow V5 Record
Convenience, or lack of it • Flow records are exported in a format that is convenient for the router, not for us. • e.g. The flow start and end times are in a form that is not immediately useful, milliseconds since system boot. • We have to combine data from individual flow records with header data. • Seconds since epoch is the Right Thing • Flow Start Time = Unix Seconds + Unix Nanoseconds - sysUpTime + flow_start • (After we’ve converted all these to the right units) • ICMP Type is stored in the destination port field
Examining Netflow • Part of our job is using netflow data to see what’s happened/is happening on the network • We spend a significant amount of time processing the archived data looking for particular behaviors. • Typically in response to institutional requests
Netflow Collection • We collect flow data from Abilene core routers. • Archives raw records (up to 3 months) • (Redirect to other lab machines) • Primary data source for research & responses to operational issues.
Problems with Pre-processing • We can do all kinds of pre-processing ahead of time. • You rarely know what kind of behaviour you’re going to be looking for ahead of time. • You can’t cover all the bases • Waste time generating products that you’ll never use. • But there are some simple things that are very useful.
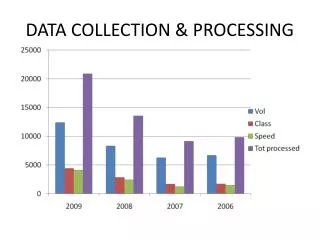
Traffic Graphing • Something as simple as graphing traffic volume can be a pain in the neck • How much traffic went to/from a given range of addresses, IP Ports, etc. • Often done using counters on routers • There are serious performance issues with this; the number of counters is limited. • It’s relatively easy if you know what you’re looking for • But we need perspective; we have to be able to turn back the clock • Using counters on routers just doesn’t work for this.
Traffic Graphing • Even with services running on known ports, there are too many in use to record all of them using routers • “bad” traffic has a habit of turning up on odd ports • It’s kind of obliged to.
Traffic Graphing • 2^16 Source ports, 2^16 destination ports; • A lot. • We can get this information from the netflow archive; • But it’s a lot of detailed data to plough through, takes a long time. • We can aggregate the data as it comes in. • Even more hosts/networks than ports • It’s hard to estimate the number of hosts; • Somewhere around 9 or 10 million on Abilene
Traffic Graphing • Simple aggregation of flow records • 15 minute intervals (convenient given archive granularity) • Break data into ICMP/TCP/UDP • Aggregate by source port, destination port, source address, destination address, and AS number
Traffic Graphing • How do we go about this? • Some cron and some Perl scripts aggregate new flow records and put them into the database every half hour • There’s a web front end so we can take a look at the graphs.
Traffic Graphing • This is not exactly rocket science; • And yet not many people do this kind of thing. • We get requests all the time • “Can I see the traffic on ports X, Y and Z for the last couple of weeks?
Traffic Graphing • Upside: • We can generate a historical view of traffic to or from any source or destination port; any Autonomous System; or any IP address or prefix. • Downside: • Aggregation means loss of data; • Plot traffic to a given port, you lose IP info and vice versa. • It still takes a while (but only a few minutes)
Vague Questions • Why is this important? • Perspective matters. History teaches us, even if it’s just the history of network traffic over the past couple of weeks. • Why isn’t it more common? Why doesn’t everyone do it? • Because they don’t think it’s especially important • It’s rather broad, isn’t it? • Macro and micro.