Download
1 / 2
20 likes | 94 Views
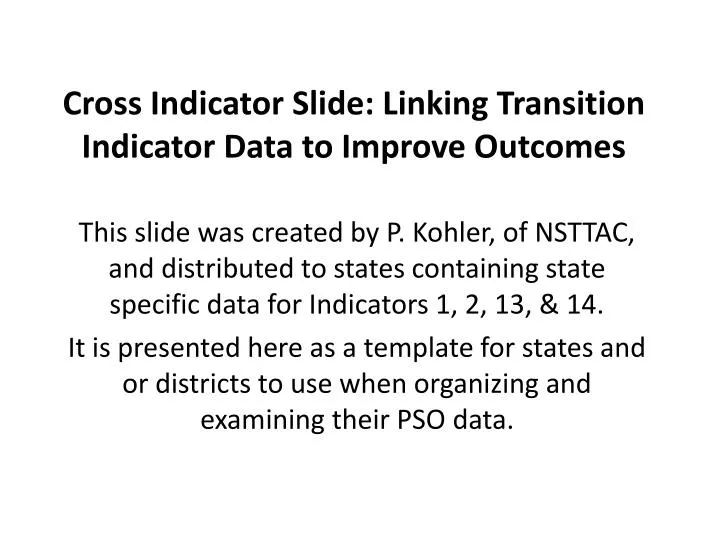
Cross Indicator Slide: Linking Transition Indicator Data to Improve Outcomes. This slide was created by P. Kohler, of NSTTAC, and distributed to states containing state specific data for Indicators 1, 2, 13, & 14.

E N D
Cross Indicator Slide: Linking Transition Indicator Data to Improve Outcomes This slide was created by P. Kohler, of NSTTAC, and distributed to states containing state specific data for Indicators 1, 2, 13, & 14. It is presented here as a template for states and or districts to use when organizing and examining their PSO data.
Linking Transition Indicator Data to Improve Outcomes Post-School Outcomes ~Indicator 14~ 2005-06 = ___% Baseline Engagement 2006-07 = ___% 2007-08 = ___% Okay? Not Okay? Why or Why Not? • Dropout Rate • ~Indicator 2~ 2004-05 = ___% 2005-06 = ___% 2006-07 = ___% 2007-08 = ___% • Graduation Rate • ~Indicator 1~ 2004-05 = ___% 2005-06 = ___% 2006-07 = ___% 2007-08 = ___% Quality of Our IEPs ~Indicator 13~ (100%) 2005-06 = ___% 2006-07 = ___% 2007-08 = ___% Kohler (2006) NSTTAC