Download
1 / 15
160 likes | 290 Views
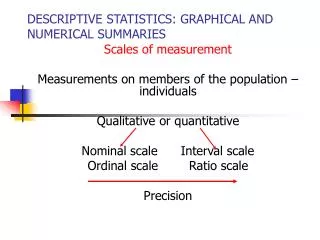
Precalculus. Lesson 9.6. Statistics and Data (Graphical). Quick Review. What you’ll learn about. Statistics Displaying Categorical Data Stemplots Frequency Tables Histograms Time Plots … and why Graphical displays of data are increasingly prevalent in

E N D
Precalculus Lesson 9.6 Statistics and Data (Graphical)
What you’ll learn about • Statistics • Displaying Categorical Data • Stemplots • Frequency Tables • Histograms • Time Plots … and why Graphical displays of data are increasingly prevalent in professional and popular media. We all need to understand them.
Leading Causes of Death in the United States in 2010 • Cause of Death Number of Percentage Deaths Heart Disease 616,067 25.4 Cancer 562,875 23.2 Stroke 135,952 5.6 Chronic Lower Respiratory 127,924 5.3 Accidents 123,706 5.1 Alzheimer’s 74,632 3.1 Diabetes 71,382 2.9 Influenza & Pneumonia 52,717 2.2 Other 658,457 27.2 Source: Centers for Disease Control and Prevention, as reported on http://www.cdc.gov/nchs/fastats/deaths.htm
Bar Chart, Pie Chart, Circle Graph Causes of Death in the United States in 2010
Constructing Stem-and-Leaf Plots Data set: 13 21 23 34 45 41 20 10 22 42 32 Key: 1|0 = 10 Stem-and-leaf plot: an arrangement of digits that is used to display and order numerical data.
Example Making a Stem-and-Leaf plot Data set: 205 207 210 224 226 201 215 Key: 20|1 = 201
Bar Graph • A bar graph can be used to display and compare data. • The scale should include all the data values and be easily divided into equal intervals.
Histogram • Histogram is a bar graph that shows the frequency of data within equal intervals. • There is no space in between the bars.
How to make a histogram? The table below shows the number of hours students watch TV in one week. Make a histogram of all the data.
How to make a histogram? Step 1 • Make a frequency table of the data. Be sure to use equal intervals.
How to make a histogram? Step 2 Choose an appropriate scale and interval for the vertical axis. The greatest value on the scale should be at least as great as the greatest frequency. Step 3 Draw a bar for each interval. The height of the bar is the frequency for that interval. Bars must touch but not overlap. Label the axes and give the graph title
Homework: Text pg769 Exercises #23 and #24