Download
1 / 53
530 likes | 636 Views
Chapter 2 Observing and Explaining the Economy. Key points . Economists try to explain facts & observations about the economy Tables & graphs help organize the info GDP is a measure of all the goods and services produced in a country during a period of time

E N D
Key points • Economists try to explain facts & observations about the economy • Tables & graphs help organize the info • GDP is a measure of all the goods and services producedin a country during a period of time • Correlation does not imply causation • Establishing causation is more difficult in econ because controlled experiments are rare. • Recent advances improve this situation • Economic observations not always accurate; e.g. quality of service difficult to measure
Economic models (p.35) • Economists use economic models to explain economic observations. Models are simplifications of reality & have variables & constants. Types of representation: verbal, with numerical tables, with graphs, with algebra. • New models are developed because existing models cannot explain facts or observations.
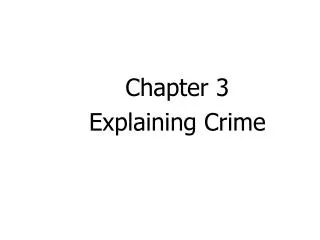
Gross Domestic Product (GDP) in the United States, 1990-1999
Time-Series Graphs • Any series of data that is measured over time is called a time-series. A series that is plotted over time is called a time-series graph. • We use a time-series graph to describe the behavior of a series over time. Economic models are used to explain the behavior.
positive economics: what is or will be normative economics: what ought to be
ceteris paribus: “all other things equal”
apples $0.30 At a particular price of apples, people buy a certain quantity of apples.
apples $0.30 $0.50 Ceteris paribus, when the price of apples increases, people buy fewer apples.
But suppose people’s incomes increase at the same time that the price of fruit goes up. Perhaps, originally we had a little income...
apples $0.30 $0.50 Then people may buy more apples even though the price of apples has gone up. The ceteris paribus assumption (other things constant) has been violated. Income is not constant.
Correlation • Two series of data may be related. Correlation (positive and negative) measures the potential relationship. • What can you say about the correlation between good grades on economic tests and time spent partying?
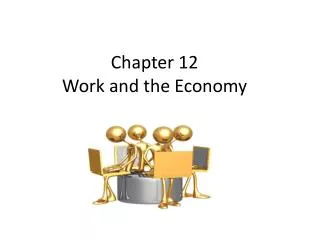
Relative Price of Health Care versus Health-Care Spending Share
Correlation and Causation • Correlation and causation are not the same. To say that two series are correlated does not mean that one causes (leads) another. Correlation between two series may be caused by a third series. • Interesting perspective- http://www.youtube.com/watch?v=lbODqslc4Tg • Classroom perspective- http://www.youtube.com/watch?v=5zyruPbgxyM
Economic Data • Data measure the interaction of households (consumers), firms, and governments. Most interaction occurs in markets. • A market is a mechanism in which exchange between buyers and sellers take place.
Gross Domestic Product • Gross domestic product (GDP) is the total market value of all final goods and services produced within a given period by factors of production located within a country.
National Incomeand Product Accounts • National income and product accounts are data collected and published by the government describing the various components of national income and output in the economy. • The U.S. Department of Commerce is responsible for producing and maintaining the “National Income and Product Accounts” that keep track of GDP.
Final Goods and Services • The term final goods and services in GDP refers to goods and services produced for final use. • Intermediate goods are goods produced by one firm for use in further processing by another firm.
Value Added • Value added is the difference between the value of goods as they leave a stage of production and the cost of the goods as they entered that stage. • In calculating GDP, we can either sum up the value added at each stage of production, or we can take the value of final sales.
Examples of value added • There are four major ways that value is added to crops along the value chain: • Product transformation • Distribution • Storage • Added service
Product transformation • Product transformation describes the process of taking a crop from its raw or commodity state and transforming it into a different form. This could be as simple as tying three ornamental corn ears together for sale at a farmers market. Product transformation could also be as complex as harvesting a specific variety of wheat that is ground into flour, used to make fresh pasta, and packaged for delivery to retail stores.
Distribution within the value chain involves any transportation of crops to a more convenient buying location. Nursery plant sales via the Internet are one example of adding value to crop production via distribution. • Storage has long been utilized by grain and oilseed growers to warehouse crops in anticipation of future price increases or while awaiting contract delivery dates. Storage is also a common “next step” for producers of fruit and vegetable crops wanting to add value to crop production.
Added service refers to providing information or services that increase a crop product’s value. Farmers market vendors or Community Supported Agriculture (CSA) producers might provide customers with recipes utilizing new and unfamiliar vegetables. Nutritional information about crops might be provided for direct market consumers.
Exclusions of Used Goodsand Paper Transactions • GDP ignores all transactions in which money or goods change hands but in which no new goods and services are produced.
Exclusion of Output Produced Abroadby Domestically Owned Factors of Production • GDP is the value of output produced by factors of production located within a country. Output produced by a country’s citizens, regardless of where the output is produced, is measured by gross national product (GNP).
Calculating GDP GDP can be computed in two ways: • The expenditure approach: A method of computing GDP that measures the total amount spent on all final goods during a given period. • The income approach: A method of computing GDP that measures the income—wages, rents, interest, and profits—received by all factors of production in producing final goods.
The Expenditure Approach Expenditure categories: • Personal consumption expenditures (C)—household spending on consumer goods. • Gross private domestic investment (I)—spending by firms and households on new capital: plant, equipment, inventory, and new residential structures.
The Expenditure Approach • Government consumption and gross investment (G) Expenditure categories: • Net exports (EX – IM)—net spending by the rest of the world, or exports (EX) minus imports (IM)
The Expenditure Approach • The expenditure approach calculates GDP by adding together the four components of spending. In equation form:
Personal Consumption Expenditures • Personal consumption expenditures (C) are expenditures by consumers on the following: • Durable goods: Goods that last a relatively long time, such as cars and appliances. • Nondurable goods: Goods that are used up fairly quickly, such as food and clothing. • Services: Things that do not involve the production of physical things, such as legal services, medical services, and education.
Gross Private Domestic Investment • Investment refers to the purchase of new capital. • Total investment by the private sector is called gross private domestic investment. It includes the purchase of new housing, plants, equipment, and inventory by the private sector.
Gross Private Domestic Investment • Nonresidential investment includes expenditures by firms for machines, tools, plants, and so on. • Residential investment includes expenditures by households and firms on new houses and apartment buildings. • Change in inventories computes the amount by which firms’ inventories change during a given period. Inventories are the goods that firms produce now but intend to sell later.
Gross Private Domestic Investment • Remember that GDP is not the market value of total sales during a period—it is the market value of total production. • The relationship between total production and total sales is: GDP = final sales + change in business inventories
Gross Investmentversus Net Investment • Gross investment is the total value of all newly produced capital goods (plant, equipment, housing, and inventory) produced in a given period. • Depreciation is the amount by which an asset’s value falls in a given period. • Net investment equals gross investment minus depreciation. capitalend of period = capitalbeginning of period + net investment
Government Consumptionand Gross Investment • Government consumption and gross investment (G) counts expenditures by federal, state, and local governments for final goods and services.
Net Exports • Net exports (EX – IM) is the difference between exports and imports. The figure can be positive or negative. • Exports (EX) are sales to foreigners of U.S.-produced goods and services. • Imports (IM) are U.S. purchases of goods and services from abroad).
The Income Approach • National income is the total income earned by the factors of production owned by a country’s citizens. • The income approach to GDP breaks down GDP into four components: GDP = national income + depreciation + (indirect taxes – subsidies) + net factor payments to the rest of the world + other
From GDP to Disposable Personal Income • Net national product equals gross national product minus depreciation; a nation’s total product minus what is required to maintain the value of its capital stock. • Personal income is the income received by households after paying social insurance taxes but before paying personal income taxes.