Download
1 / 24
290 likes | 454 Views
CMMI ® and V&V: Best Practices in Acquisition and Development Verification and Validation Summit 2009. Mike Phillips Software Engineering Institute Carnegie Mellon University. ® CMMI is registered in the U.S. Patent and Trademark Office by Carnegie Mellon University. SEI Background.

E N D
CMMI® and V&V:Best Practices in Acquisition and DevelopmentVerification and Validation Summit 2009 Mike Phillips Software Engineering Institute Carnegie Mellon University ® CMMI is registered in the U.S. Patent and Trademark Office by Carnegie Mellon University.
SEI Background Funded by the U.S. government as a research & development lab; (FFRDC) Created in 1984 and administered by Carnegie Mellon University Headquartered in Pittsburgh, Pennsylvania; offices and support worldwide
My Background…. Performed developmental testing for USAF Planned and then managed testing for B-2 Managed CMMI since 2000 Led development of CMMI for Acquisition
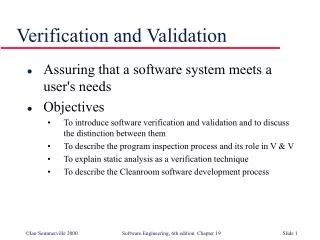
SEI Mission and Strategy Mission Strategy The SEI advances software engineering and related disciplines to ensure systems with predictable and improved quality, cost, and schedule.
5 Optimizing 4 Quantitatively Managed 3 Defined 2 Managed 1 Initial CMMI®: Staged Representation • Organizational Innovation and Deployment • Causal Analysis and Resolution • Requirements Development • Technical Solution • Product Integration • Verification • Validation • Organizational Process Focus • Organizational Process Definition + IPPD • Organizational Training • Integrated Project Management + IPPD • Risk Management • Decision Analysis and Resolution • Organizational Process Performance • Quantitative Project Management • Requirements Management • Project Planning • Project Monitoring and Control • Supplier Agreement Management • Measurement and Analysis • Process and Product Quality Assurance • Configuration Management
5 Optimising 4 Quantitatively Managed 3 Defined 2 Managed 1 Performed CMMI®: Continuous Representation GP 5.1 Ensure Continuous Process Improvement GP 5.2 Correct Root Causes of Problems + GENERIC PRACTISES OF LEVEL 4 GP 4.1 Establish Quantitative Objectives for the Process GP 4.2 Stabilize Subprocess Performance + GENERIC PRACTICES OF LEVEL 3 GP 3.1 Establish a Defined Process GP 3.2 Collect Improvement Information + GENERIC PRACTICES OF LEVEL 2 GP 2.1 Establish an Organizational Policy GP 2.2 Plan the Process GP 2.3 Provide Resources GP 2.4 Assign Responsibilities GP 2.5 Train People GP 2.6 Manage Configurations GP 2.7 Identify and Involve Relevant Stakeholders GP 2.8 Monitor and Control the Process GP 2.9 Objectively Evaluate Adherence GP 2.10 Review Status with higher Level Management + BASE PRACTICES OF LEVEL 1 GP 1.1 Perform Base Practices 0 Incomplete
Level 5 S E Probability Probability Probability Probability Probability Time / Cost Level 4 Time / Cost Time / Cost Time / Cost Time / Cost E S Level 3 E S Level 2 S E Level 1 S E Visibility & Predictability Source: SEPG Asia Pacific 2009 presented by Ravindra Nath, KUGLER MAAG CIE GmbH Management Visibility Business View Target Target Target Target Target
Defects : Insertion Pattern & Cost of Removal Require- ments Software Test System Test Field Use Design Code Where Defects are Introduced 10% 40% 50% Relative Cost to Fix $1 $1 $1 $6 $12 $100 Source: SEPG Asia Pacific 2009 presented by Ravindra Nath, KUGLER MAAG CIE GmbH
Level 5 Level 4 Level 3 Level 2 Level 1 Early Defects Detection Source: SEPG Asia Pacific 2009 presented by Ravindra Nath, KUGLER MAAG CIE GmbH Relative Cost Require- ments Software Test System Test Field Use Design Code 5% 20% 40% 20% 10% <5% $800 3% 12% 30% 30% 20% 5% $1,000 0% 2% 20% 38% 32% 8% $1,400 0% 0% 3% 30% 50% 17% $2,500 0% 0% 2% 15% 50% 33% $4,000
Three Complementary CMMI Constellations CMMI-SVC CMMI-SVC provides guidance for those providing services within organizations and to external customers CMMI-DEV provides guidance for measuring, monitoring, and managing development processes 16 Core process areas common to all CMMI-ACQ CMMI-DEV CMMI-ACQ provides guidance to enable informed and decisive acquisition leadership
Visibility into the Team’s Capability OperationalNeed Acquirer CMMI for Acquisition Acquisition Planning RFPPrep. Solicita-tion Source Selection Program Leadership Insight / Oversight System Acceptance Transition CMMI for Development Design Plan Develop Integrate& Test Deliver Developer
CMMI-ACQ v1.2Acquisition Category Process Areas Solicitation & Supplier Agreement Development AgreementManagement Acquisition Requirements Development Acquisition Validation 16 Core Process Areas AcquisitionTechnical Management Acquisition Verification
Acquisition Technical Management - Goals SG 1: Evaluate Technical Solutions Supplier technical solutions are evaluated to confirm that contractual requirements continue to be met. SG 2: Perform Interface Management Selected interfaces are managed.
Examples of technical reviews Initial Technical Review (ITR) Alternative System Review (ASR) Integrated Baseline Review (IBR) Technology Readiness Assessment (TRA) System Requirements Review (SRR) System Functional Review (SFR) Preliminary Design Review (PDR) Critical Design Review (CDR) Test Readiness Review (TRR) System Verification Review (SVR) Production Readiness Review (PRR) Operational Test Readiness Review (OTRR) Physical Configuration Audit (PCA )
Acquisition Verification - Specific Goals SG 1: Prepare for Verification Preparation for verification is conducted. SG 2: Perform Peer Reviews Peer reviews are performed on selected work products. SG 3: Verify Selected Work Products Selected work products are verified against their specified requirements.
Acquisition Verification - Summary Verification includes • Selecting work products for verification • Establishing a verification environment • Establishing criteria and procedures • Preparing for and conducting peer reviews • Analyzing peer review data • Performing verification • Analyzing verification results and identifying corrective actions
Acquisition Validation - Goals SG 1: Prepare for Validation Preparation for validation is conducted. SG 2: Validate Selected Products and Product Components Selected products and product components are validated to ensure that they are suitable for use in their intended operating environment.
Analysis – Test Metrics Source: ITEA Annual Symposium 2009presented by 46 Test Wing from Eglin Air Force Base, FL
Analysis – Test Metrics Coverage and Legacy continue to be the two largest categories Mistakes decreased - good thing! Source: ITEA Annual Symposium 2009presented by 46 Test Wing from Eglin Air Force Base, FL
Analysis – Test Metrics Source: ITEA Annual Symposium 2009presented by 46 Test Wing from Eglin Air Force Base, FL
Analysis – Test Metrics Good Containment Checklists have been updated to address/catch these issues in the future This project did not accomplish design Source: ITEA Annual Symposium 2009presented by 46 Test Wing from Eglin Air Force Base, FL
Analysis – Statistical Control Reducing process variation is the key to improving productivity and quality. • Control charts provide a quick method to evaluate process stability/capability • Boxplots provide a method to determine if performance is significantly different by group, state, model, date range • Time Series plots provide a method to evaluate data patterns and behavior over time
What Have We Missed? Now let’s chat….
Acknowledgements Slides 18,19, 20, and 21 are from a presentation given at the ITEA Annual Symposium 2009. It was presented by Ms Kathy Reid of the 46 Test Wing from Eglin Air Force Base, FL. Slides 7, 8, and 9 are from a presentation given at SEPG Asia Pacific 2009. It was presented by Mr RavindraNath from KUGLER MAAG CIE, GmbH, Kornwestheim, Germany.