Download
1 / 16
160 likes | 263 Views
The study of Quartz Textures in Multiphase rocks using Neutron Diffraction Texture Analysis at the JINR, Dubna. G.F. Ndlovu 1 , T.I. Ivankina 2 , R.N. Vasin 2. 1 Council for Scientific and Industrial Research (CSIR), Pretoria, South Africa

E N D
The study of Quartz Textures in Multiphase rocks using Neutron Diffraction Texture Analysis at the JINR, Dubna G.F. Ndlovu1, T.I. Ivankina2, R.N. Vasin2 1 Council for Scientific and Industrial Research (CSIR), Pretoria, South Africa 2 Frank Laboratory of Neutron Physics,Joint Institute for Nuclear Research, Dubna, Russia JINR, Summer Student Practice, September 2009
Main topics • Why Quartz • Why measure texture • Goals • Methods • Results • Experimental • Theoretical • Conclusions • Acknowledgements
Why Quartz • Most common compound in the Earth’s Crust (SiO2 ) and most useful • Occurs in all environments and all rock types - sedimentary, metamorphic or igneous • Its piezoelectric properties make it highly useful in modern technology OKU 818 Composition - quartz (~40%) - mica (~30-40%) - plagioclase (~20-30%) Outokumpu Deep Drilling Project depth - 2516 m
Single crystal Texture Property Rock sample (marble) Why do geologists measure texture? • The modelling of physical anisotropies (seismic wave velocities,heat conductivity, thermal expansion, magnetic, piezoelectric, etc.) of rocks • Deconvolution of the deformation history of rocks on the basis of the symmetry of the mineral textures, which commonly reflect the symmetry of deformation
Many materials are polycrystalline bodies, i.e. they consist of grains (crystallites) with a different size and orientation. Crystallographic texture is the lattice (or crystallographic) preferred orientation of crystallites of the same phase (mineral) in the chosen coordinate system: LPO (or CPO). Crystallographic texture Random orientation: NO crystallographic texture Aligned grains: One-component crystallographic texture Multi-component crystallographic texture • The properties of the polycrystal are anisotropic and depend upon texture
Objectives • Learn about the operation of the SKAT diffractometer • Measure the diffraction spectra of geological samples (quartz-bearing) • Use AutoIndex, GeoTOF, Pole Figure plot and Beartex programs • Indexation of spectra • Extracted experimental pole figures from spectra • Obtain quantitative 3D orientation distribution function (ODF)- quantitative measure of texture
Methods • Experimental • using neutrons creates completely new possibilities, some of which are unique and inaccessible by x rays • Main Advantages of Neutron Diffraction Technique • low absorption of neutrons in matter »large sample volumes accessible • TOF » complete diffraction patterns can be recorded • application of multiple detectors» measurements are fast • excellent spectral resolution » suitable for polyphase geological samples with many diffraction lines • unique scattering angle 2 of all detectors» minimum of intensity corrections required A S S A S A Pole figure raster Pole sphere The grid of the measured pole figure. Small circle correspondsto the plane projection of the scattering vectors, dots shown where the data on pole density are situated. The line on the unit sphere corresponds to the scattering vectors of detector ring, line in the XY plane is its stereographic projection. Texture diffractometer SKAT operates in the beam of the reactor IBR-2 (JINR, Dubna, Russia). 19 detectors are placed completely on the assembly ring maintaining the axial symmetry with respect to the neutron beam Schematic view of the SKAT’s detector system. 19 detector modules named from A to S, with S in the center of the pole figure.
Za Ya Xa Theoretical Methods The traditional method for the representation of preferred orientations is pole figures, i.e.,stereographic projection of the normals to the planes (hkl). A pole figure gives an answer to the question:Which volume fraction of the sample have a orientation for which the lattice plane normal coincide with a sample direction Z Sphericalcoordinates of normal to crystalographic plane (001)( pole P2) Zb β Neutron diffraction quartz PF (11-20) Xb stereographic projection of pole Р 2 Mathematic description of the crystallographic texture:orientation distribution function (ODF)f(g),where (g) corresponds to the rotation to align the coordinate system of the sample Ka with the coordinate system of the crystallite Kb. α (Xa,Ya,Za): Ka – right-handed, Cartesian sample coordinate system. (Xb,Yb,Zb): Kb – right-handed, Cartesian crystal coordinate system. Quantitatively the orientation of the certain crystallite (g)is described by three Euler anglesg={α,β,γ}. All the possible orientations (0 ≤ α,γ ≤ 2π; 0 ≤ β ≤ π) form the orientation G-space. f (g) describes the volumetric fraction of crystallites with the orientation g+dg. It is normalized to 1: γ Yb
Data processing Normalized diffraction spectra Experimental pole figures (measured simultaneously due to application of TOF-method) Calculation of the ODF (WIMV method) • Recalculation of pole figures using the ODF • (0001) - absent reflection • (11-20), • (10-11), (01-11) – overlapped. ODF characteriztion: texture index F2, construction of the ODF-histogram and ODF-spectrum
Crystallographic textures that are characteristic of quartzites A.N. Nikitin, T.I. Ivankina, K. Ullemeyer, R.N. Vasin, 2008, published in Kristallografiya, 2008, Vol. 53, No. 5, pp. 859–866 Dauphine twins, type I: two crystals, one rotated around [0001]on 180°. Pole figures, stereographic projection, linear scale contours. PFs exhibit strong, symmetrically dependent peaks of high pole density Model texture, type II (type I + misorientation) Pole figures, stereographic projection, linear scale contours. Differ from the first-type textures by diffused peaks and lower pole density
Analogous quartz textures in different rocks Model texture, type III (rotation around normal to (02-23)) Pole figures, stereographic projection, linear scale contours, rotation axis direction: left to right. The (001) PF exhibits a diffused pole-density peak with a tendency to waist distribution of c axes along small-circle arcs Model texture, type IV (rotation around normal to (02-21)) Pole figures, stereographic projection, linear scale contours, rotation axis direction: left to right.
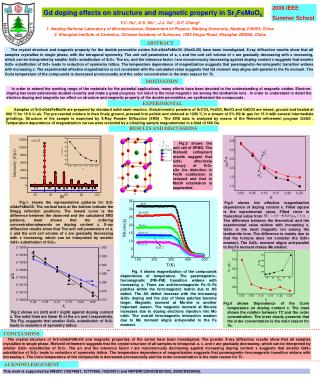
Results Fig. 1. Diffraction spectrum and pole figures corresponding to indexed reflections for the OKU 818 quartzite sample (11-21) (10-11) (10-10) (10-12) (11-20) Intensity, a.u Experimental pole figures TOF-chanels • Recalculation of pole figures using the ODF • (11-21),(01-11) - absent reflection • (10-11), (01-12) – overlapped • Themain objective of texture analysis is to obtain information on the crystal orientation distribution in the sample • Incomplete pole figures and regions of the diffraction spectrum containing overlapping peaks
Recalculated pole figures of the principle crystallographic planes 001 101 110 011 0.3 1.6 0.5 1.3 0.6 1.3 0.6 1.6 • The texture of a polycrystalline sample is a statistical ensemble of crystallites. • A statistically representative number of crystallites or grains is needed to obtain reliable information. • Obtaining reproducible pole figures requires 104–105 grains
Conclusions • Experimental PFs were used to reconstruct ODFs, on the basis of which PFs were calculated for the principal directions in quartz bearing rock samples • The rock sample under study exhibit a strong quartz texture (the maximum pole density > 1.56) • Pole figure data processing yielded the complete texture for quartz • In addition to the mineral textures factors like oriented, microcracks and grain boundaries control the elastic properties of rock samples • Useful in studying how quartz grains interact with or are affected by other minerals during deformation Remarks • Improve the intensity/background ratio and increase the flux of thermal neutrons at the sample position
Acknowledgements • Many thanks to the following Organisations and Personnel • JINR, Dubna • FNL, JINR, Dubna • Dr. Tatyana Ivankina • Dr. Roman Vasin • The NRF • Dr. Noel Jacobs • The CSIR & Univ of Free State • Prof. Thembela Hillie • Prof. Wiets Roos