Download
1 / 1
10 likes | 75 Views
Li and Xue, Supplemental Figure 2. A. 0 1 nM 10 nM 100 nM 1 µ M (IAA). C LO11 LO19. C LO11 LO19. C LO11 LO19. C LO11 LO19. C LO11 LO19. pO-PLD z 2. 0 1 nM 10 nM 100 nM 1 µ M (IAA).

E N D
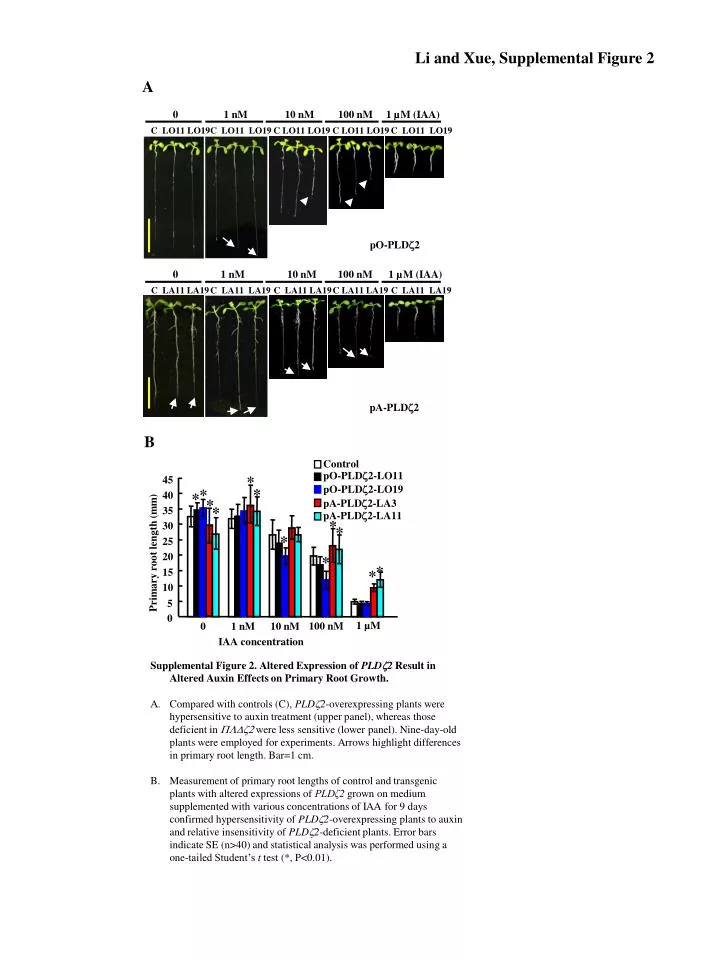
Li and Xue, Supplemental Figure 2 A 0 1 nM 10 nM 100 nM 1 µM (IAA) C LO11 LO19 C LO11 LO19 C LO11 LO19 C LO11 LO19 C LO11 LO19 pO-PLDz2 0 1 nM 10 nM 100 nM 1 µM (IAA) C LA11 LA19 C LA11 LA19 C LA11 LA19 C LA11 LA19 C LA11 LA19 pA-PLDz2 B Control * pO-PLDz2-LO11 45 * * pO-PLDz2-LO19 * 40 * pA-PLDz2-LA3 * 35 pA-PLDz2-LA11 * * 30 * 25 Primary root length (mm) * 20 * * 15 10 5 0 1 µM 100 nM 0 1 nM 10 nM IAA concentration • Supplemental Figure 2. Altered Expression of PLDz2 Result in Altered Auxin Effects on Primary Root Growth. • Compared with controls (C), PLDz2-overexpressing plants were hypersensitive to auxin treatment (upper panel), whereas those deficient in PLDz2 were less sensitive (lower panel). Nine-day-old plants were employed for experiments. Arrows highlight differences in primary root length. Bar=1 cm. • Measurement of primary root lengths of control and transgenic plants with altered expressions of PLDζ2 grown on medium supplemented with various concentrations of IAA for 9 days confirmed hypersensitivity of PLDz2-overexpressing plants to auxin and relative insensitivity of PLDz2-deficient plants. Error bars indicate SE (n>40) and statistical analysis was performed using a one-tailed Student’s t test (*, P<0.01).