1 / 23

7 QC Tools:

7 QC Tools: . Flowchart Check Sheet Histogram Pareto Cause-and-Effect Scatter Control Chart. Pareto Diagram. Step 1: Decide on problem, type of data, and causes or categories. Step 2: Collect the data. . Step 3: Order the causes or categories. .

kaipo
Download Presentation

7 QC Tools:

An Image/Link below is provided (as is) to download presentation Download Policy: Content on the Website is provided to you AS IS for your information and personal use and may not be sold / licensed / shared on other websites without getting consent from its author. Content is provided to you AS IS for your information and personal use only. Download presentation by click this link. While downloading, if for some reason you are not able to download a presentation, the publisher may have deleted the file from their server. During download, if you can't get a presentation, the file might be deleted by the publisher.

E N D

Presentation Transcript


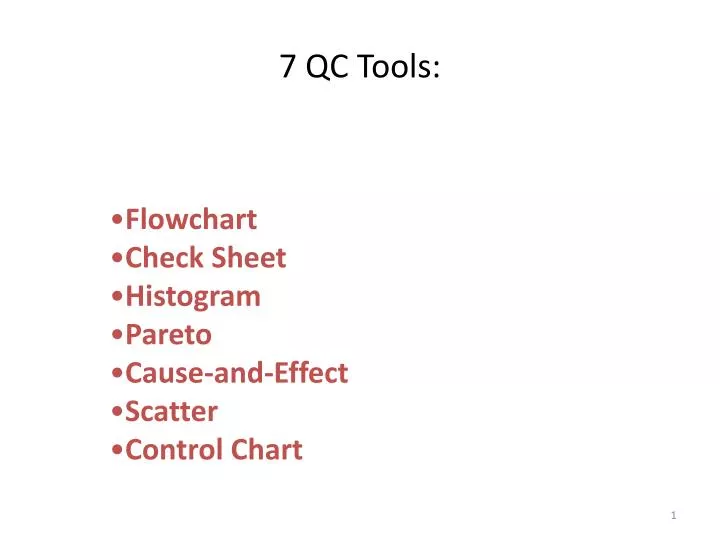
  1. 7 QC Tools: • Flowchart • Check Sheet • Histogram • Pareto • Cause-and-Effect • Scatter • Control Chart

  2. Pareto Diagram

  3. Step 1: Decide on problem, type of data, and causes or categories.

  4. Step 2: Collect the data.

  5. Step 3: Order the causes or categories.

  6. Step 4: Calculate the cumulative totals.

  7. Step 5: Draw and label the horizontal axis.

  8. Step 6: Draw, scale, and label the vertical axis.

  9. Step 7: Draw bars for each cause or category.

  10. Step 8: Draw cumulative total lines.

  11. Interpret the Pareto Chart.

  12. Pareto Diagram (Using EXCEL) • Create a table listing the sources of defects in the first column • and in the second column calculate the total number of defects per • source.

  13. Sort the table by the total number of defects in descending order. • In the third column, calculate the cumulative percentage for each row • in the table. • Create a chart with the ChartWizard (custom --- line-column • on two axes).

  14. Cause and Effect Diagram

  15. Step 1: Develop problem statement.

  16. Step 2: Brainstorm causes.

  17. Step 2: Brainstorm causes.

  18. Step 3: Determine the major cause categories.

  19. Step 4: Determine the category for Each listed cause.

  20. Step 4: Determine the category for Each listed cause.

  21. Step 5: Put categories and causes On cause & effect diagram.

  22. Step 6: Identify the most likely causes.

More Related