Download
1 / 66

E N D
1. Live Reorderable Accordion Drawing (LiveRAC) Peter McLachlan
MSc Thesis Presentation
September, 2006
2. 2 Presentation Overview Motivation
Related Work
LiveRAC Overview and Implementation
Discussion
3. 3 Problem Domain �Managed Hosting Services�, data center operations staff Define managed hosting services
Define data centers
Define network operations center
It�s a central management location for a �data warehouse�, managing hundreds or thousands of servers
May service one client or many
System administrators
Be less verbose!Define managed hosting services
Define data centers
Define network operations center
It�s a central management location for a �data warehouse�, managing hundreds or thousands of servers
May service one client or many
System administrators
Be less verbose!
4. 4 Network Devices Network device: any electronic device that connects to a computer network
Most network devices can be monitored
Network Operation Centre (NOC): facility for monitoring large numbers of network devices Telegraphic style?
Mention by name: routers, network servers, workstations, switches, etc.
Telegraphic style?
Mention by name: routers, network servers, workstations, switches, etc.
5. 5 Monitored Data Most data collected from network devices is time-series data
time stamp and value
Two types of time-series objects collected:
performance metrics
[ 10 AUG 2006 9:52:37, CPU, 95% ]
alarm data
[ 10 AUG 2006 9:52:37, MAJOR, �HIGH TEMP� ]
Key difference for visualization:
performance metrics quantitative
alarms categorical
6. 6 Detail Overload - Many tools suffer from detail overload
- Most network analysis tools require one program per data source. Operators need to have many windows open on their desktop, depriving them of important context information. When the operator drills down to investigate a single system, they are denied information regarding the higher level state of the entire system. - Many tools suffer from detail overload
- Most network analysis tools require one program per data source. Operators need to have many windows open on their desktop, depriving them of important context information. When the operator drills down to investigate a single system, they are denied information regarding the higher level state of the entire system.
7. 7 RRDTool Database system with statistical graphics
Monitors individual hosts
6-inch view
Basis for many related applications Add a few words next few slides
More Concise
Add a few words next few slides
More Concise
8. 8 Ganglia Cluster monitoring tool, uses RRDtool back-end
Provides aggregate charts, 100-mile high overview * Requires the Ganglia client to be installed! Most standard server platforms supported, but not all �network devices�. * Requires the Ganglia client to be installed! Most standard server platforms supported, but not all �network devices�.
9. 9 OpenNMS Aggregates SNMP data from multiple hosts, uses RRDtool back-end
Alarm management
1000-mile high overviews
10. 10 Scale to large, dynamic datasets
thousands of devices
dozens of data channels
multiple time scales
Three levels of activity
Visualization Solution Requirements Time scales spanning weeks to months initially. Consider scaling to years in the future.
- Manage Time scales spanning weeks to months initially. Consider scaling to years in the future.
- Manage
11. 11 Our solution: LiveRAC
Highly scalable visual representation
thousands of cells
existing back-end used for data collection and temporal aggregationHighly scalable visual representation
thousands of cells
existing back-end used for data collection and temporal aggregation
12. 12 Our solution: LiveRAC Reorderable matrix
rows of network devices
columns of time-series objects
Semantic zooming and aggregation for cells
large cells show time-series charts
compact representations in reduced areas
aggregate spatial representation shown in highly compressed regions �Semantic zooming is a technique which adjusts a data representation by the amount of area available for the representation.�
LiveRAC: reorderable matrix with graphical cells of time-series data
Rows of network devices, column of time-series objects
Large cells show charts, small cells show color-coded rectangles,
Data-dense regions aggregated to representative value
2 slides: WHAT IS LIVERAC�Semantic zooming is a technique which adjusts a data representation by the amount of area available for the representation.�
LiveRAC: reorderable matrix with graphical cells of time-series data
Rows of network devices, column of time-series objects
Large cells show charts, small cells show color-coded rectangles,
Data-dense regions aggregated to representative value
2 slides: WHAT IS LIVERAC
13. 13 Visual Introduction to LiveRAC
14. 14 Research Contributions
A scalable visualization system called LiveRAC using real world data
Algorithms and code to support dynamic and reorderable data elements in accordion drawing
Infrastructure and algorithms for user-definable semantic zoom in accordion drawing Forward reference Accordion Drawing & Semantic zoom.
Forward reference Accordion Drawing & Semantic zoom.
15. 15 Information Visualization Human visual channel is highest-bandwidth perceptual system [Norretranders, 1999]
Information visualization: field of study whose object is to aid cognition through the graphic representation of abstract data
displays relevant information graphically to assist in memory tasks
supports data exploration through direct interaction
assists in pattern finding through the display of overview and detail, search, and user-directed reordering
16. 16 Information Visualization Techniques - A few examples Small multiples Different color than green!
Need to define pre-attentive visual cue
See equally fast a dozen or a thousand �distractors�
Different color than green!
Need to define pre-attentive visual cue
See equally fast a dozen or a thousand �distractors�
17. 17 Information Visualization Techniques - A few examples Small multiples * LiveRAC uses pre-attentive color coding and small-multiples views* LiveRAC uses pre-attentive color coding and small-multiples views
18. 18 Time-Series Data Extensively explored in information visualization
Many techniques cluster similar time-series data points together, e.g. work by van Wijk et al.
LiveRAC provides many small-multiples views of time-series data
19. 19 Statistical Graphics Statistical graphics:
projection of abstract shapes representing observed quantitative data
in use for centuries in various forms [Beniger, 1978]
used throughout science and industry in commonly available tools like Excel� Modern guides to the application of statistical graphics include works by Cleveland [ Cleveland, 1985 ] (The elements of graphing data), Bertin �The Semiology of graphics� and Tufte (�Visual display of quantitative information�)
Too wordy
Modern guides to the application of statistical graphics include works by Cleveland [ Cleveland, 1985 ] (The elements of graphing data), Bertin �The Semiology of graphics� and Tufte (�Visual display of quantitative information�)
Too wordy
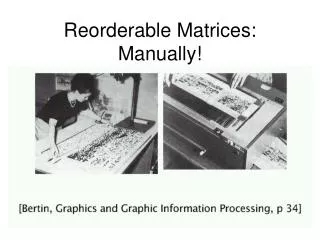
20. 20 Reorderable Visualizations Supports user-directed pattern finding when patterns are not known a priori [Bertin, 1981]
allows users to group and sort data to identify or confirm patterns
supports an intuition-driven model for interacting with data
LiveRAC adds reordering to accordion drawing Heat maps
Look for other examples
Look to show very clear pattern,
Just talk about reordering? Maybe drop matrix.
Heat maps
Look for other examples
Look to show very clear pattern,
Just talk about reordering? Maybe drop matrix.
21. 21 Semantic zooming Semantic zooming represents data differently at different zoom levels [Perlin, 1993]
Optimize representation for available space
Allow multiple levels of detail
Delete middle 5
Delete middle 5
22. 22 Accordion Drawing Information visualization technique
Stretch-and-squish navigation
enlarge some areas while retaining surrounding context
Guaranteed visibility
important landmarks remain visible Background rubber sheet navigation
definition and benefits of guaranteed visibility
Background rubber sheet navigation
definition and benefits of guaranteed visibility
23. 23 PowerSetViewer Dynamic accordion drawing
insert and remove data at run time
Limitations:
domain-specific solution
not user-reorderable Fix scaling
Background rubber sheet navigation
Video of accordion drawing in action!!
definition and benefits of guaranteed visibility
Define PRISAD � should this be on a slide somewhere?? Fix scaling
Background rubber sheet navigation
Video of accordion drawing in action!!
definition and benefits of guaranteed visibility
Define PRISAD � should this be on a slide somewhere??
24. 24 PRISAD Introduces the concept of per-frame partitioning of data into screen-visible regions
Reduces n data nodes to p where p is bounded by the number of display pixels
Provides an API for developing accordion drawing applications
Limitation:
static data structures
25. 25 SWIFT SWIFT is a set of data storage, aggregation and visualization tools that integrate multiple data sources [Koutsofios, 1999]
Developed at AT&T Labs, fully deployed in a production role
Data sources include SNMP, intrusion detection systems, Windows system monitors, and custom written daemons
Highly scalable
Optimized for streaming data
- Explain why they need a new front-end
- Show 3 pictures instead of 1, shrink pictures
- Talk about back-end first
- Need a lot more detail on SWIFT
- Couple slides on what back-end can do
- Set up why SWIFT doesn't solve all problems
- Crisp up why my stuff has value!
- Explain why they need a new front-end
- Show 3 pictures instead of 1, shrink pictures
- Talk about back-end first
- Need a lot more detail on SWIFT
- Couple slides on what back-end can do
- Set up why SWIFT doesn't solve all problems
- Crisp up why my stuff has value!
26. 26 SWIFT Front-ends Existing views:
Geographic views
Node-link diagrams
Raw data text
Limitations:
Cannot compare between large numbers of time-series objects
LiveRAC: reorderable matrix visualization for SWIFT Difficult to examine dozens of graphics side-by-side
Matrix views can achieve a higher information density for abstract data
SWIFT is a set of data storage and aggregation tools that allows data from many distinct sources to be integrated into a single self-describing data format. These data sources could include SNMP, intrusion detection systems, or Microsoft Windows system monitors. The underlying system is extensible so virtually any data source can be mapped into the schema. SWIFT provides a number of visualization tools such as the geographic view of telephone data, as seen here. Difficult to examine dozens of graphics side-by-side
Matrix views can achieve a higher information density for abstract data
SWIFT is a set of data storage and aggregation tools that allows data from many distinct sources to be integrated into a single self-describing data format. These data sources could include SNMP, intrusion detection systems, or Microsoft Windows system monitors. The underlying system is extensible so virtually any data source can be mapped into the schema. SWIFT provides a number of visualization tools such as the geographic view of telephone data, as seen here.
27. 27 LiveRAC Architecture Make 1 central box in LiveRAC area: Application
Better name for API box.
Split line infrastructure: Reorderability
Top box: API & Infrastructure
Modular approach
Separate rendering and data-service threads allow interaction during data retrieval
Make 1 central box in LiveRAC area: Application
Better name for API box.
Split line infrastructure: Reorderability
Top box: API & Infrastructure
Modular approach
Separate rendering and data-service threads allow interaction during data retrieval
28. 28 LiveRAC Architecture - PRISAD Uses and enhances the PRISAD accordion drawing API
PRISAD provides:
well-established scalability
pixel-bounded rendering performance
extensive infrastructure
Contributions:
fully dynamic generic data structures
add, remove and reorder
29. 29 LiveRAC Architecture - SWIFT SWIFT back-end provides:
unified interface for multiple collected data sources
temporal aggregation
Separate rendering and data-service threads allow interaction during data retrieval
Time window can be selected to display historical or live data Multiple queries can be aggregated during each data retrieval
Redundant or unneeded queries can be discarded without consuming server resources
Navigation continues as details arrive on-demand
LiveRAC provides an information-dense time-series matrix view of SWIFT data that supports multiple comparisons and pattern finding for large quantities of devices and multiple monitoring channels
What is LiveRAC
Why do we need it if we have SWIFT?
What can LiveRAC do that can�t be done with SWIFT / how are we exploiting SWIFT?
Multiple queries can be aggregated during each data retrieval
Redundant or unneeded queries can be discarded without consuming server resources
Navigation continues as details arrive on-demand
LiveRAC provides an information-dense time-series matrix view of SWIFT data that supports multiple comparisons and pattern finding for large quantities of devices and multiple monitoring channels
What is LiveRAC
Why do we need it if we have SWIFT?
What can LiveRAC do that can�t be done with SWIFT / how are we exploiting SWIFT?
30. 30 Semantic Zooming CPU usage at several levels of detail
Add and remove data series depending on SZ level
Utilize any of the underlying chart features
Add and remove data series depending on SZ level
Utilize any of the underlying chart features
31. 31 Variable LOD Charts jGLChartUtil: High-performance OpenGL statistical graphics library
Several data representations:
line charts
scatter charts
bar charts
histograms
sparklines
32. 32 Variable LOD Charts Optimizes chart representation for best use of available space
scales fonts
�best fit� axis labeling
modifies chart grid
Representation and size selected by application, not library
33. 33 Defining Semantic Zoom Levels Bundle: specification of how to draw cells in a column
defines graphical representation at different cell sizes
can contain single or multiple time-series objects
pre-defined in configuration file
Generic bundles provide defaults provides general purpose representation levels for time-series objectsprovides general purpose representation levels for time-series objects
34. 34 Aggregation At lowest level of detail, multiple rows are aggregated to single visual representation
convey single useful value for large quantity of information
Aggregated representation is colored box with varying saturation
for alarms, color indicates highest severity alarm
gray indicates metric data
saturation is a function of density
35. 35 LiveRAC Semantic Zooming
36. 36 Reordering LiveRAC allows rows and columns to be reordered
rows sorted by device name, or by customer identifier and sub-sorted by device name, or ordered arbitrarily
columns ordered arbitrarily, locations specified by user
Required significant extensions to PRISAD to provide dynamic data structures
Flag verbally: details in written thesis for those interested in PRISAD extensions
- KEY: THIS IS A BIG AND GIANT COMPLICATED DATA SET, EXPLORATION AND DON'T KNOW WHAT THEY ARE LOOKING FOR> HERE ARE SOME WAYS TO CHANGE PICTURE, BECAUSE WE DON'T KNOW APRIORI
Flag verbally: details in written thesis for those interested in PRISAD extensions
- KEY: THIS IS A BIG AND GIANT COMPLICATED DATA SET, EXPLORATION AND DON'T KNOW WHAT THEY ARE LOOKING FOR> HERE ARE SOME WAYS TO CHANGE PICTURE, BECAUSE WE DON'T KNOW APRIORI
37. 37 Reordering Rows and Columns - Visual Example
38. 38 LiveRAC Data Playback Playback consists of advancing the time window by a configurable duration at regular intervals
Historical data can be viewed faster than real-time
Current data can be viewed in real-time
39. 39
40. 40 Discussion & Results LiveRAC was deployed using real world data at AT&T Labs
LiveRAC proved to be scalable
interactive frame rates
4000+ device rows
dozens of performance/alarm columns
exploration of data revealed interesting patterns including:
uneven distribution of load across clusters
evidence of idle/unneeded processes on some web servers
impact of web server load on filers
cyclical load
variance in /var data accumulation & cleanup
exploration of data revealed interesting patterns including:
uneven distribution of load across clusters
evidence of idle/unneeded processes on some web servers
impact of web server load on filers
cyclical load
variance in /var data accumulation & cleanup
41. 41 LiveRAC Case Study
42. 42 User Feedback
Demo feedback was positive:
users familiar with the old system were able to quickly recognize customers based on familiarity with the data
LiveRAC identified by domain managers as possible next-generation tool for data center usage
users had numerous suggestions for the system, a good indication that they were excited by the possibilities
43. 43 Future Work Interaction:
field study LiveRAC in real-world environment
support alternative navigation options
auto-expanding search region
hot-keying groups of devices or metrics
expand data representation library
Data processing:
computational correlation of alarm and metric data
Performance:
lazy evaluation during reordering Allow user to navigate between LiveRAC and Swift3D seamlessly, viewing the same data using different metaphors
Perform more rigorous qualitative and quantitative evaluations of LiveRAC benefits, iterate on design
Provide views of actual alarm text, and possibly provide text tables for stats, to allow admins to drill �right down� to the lowest level of information if they choose.
Develop more graphical representations, for example glyphs.Allow user to navigate between LiveRAC and Swift3D seamlessly, viewing the same data using different metaphors
Perform more rigorous qualitative and quantitative evaluations of LiveRAC benefits, iterate on design
Provide views of actual alarm text, and possibly provide text tables for stats, to allow admins to drill �right down� to the lowest level of information if they choose.
Develop more graphical representations, for example glyphs.
44. 44 Conclusion Contributions:
working system for interactive visualization of large real-world time-series data sets
algorithms for reorderable accordion drawing
infrastructure for semantic zoom in accordion drawing
45. 45
46. 46 LiveRAC: A focus+context approachLiveRAC: A focus+context approach
47. 47
48. 48 Targeted User Activities Overview:
Situational awareness
Critical alarm notification
Detail:
Incident investigation
Capacity planning
Trend analysis The categorization of these is really just a high-level breakdown. Some aspects of both overview and detail may be required for any one of these tasks. Provide examples.
More time describing these tasks! Hm, maybe a demonstration task?
Talk about each of these tasks, situate them in actual administrative activities
Cut completely or moveThe categorization of these is really just a high-level breakdown. Some aspects of both overview and detail may be required for any one of these tasks. Provide examples.
More time describing these tasks! Hm, maybe a demonstration task?
Talk about each of these tasks, situate them in actual administrative activities
Cut completely or move
49. 49 Monitoring Large-scale Systems: A Difficult Problem Many disparate data sources
Different platforms
Different protocols
Different services
Lack of integrated solutions
Lack of context in standard tools
Shortage of integrated visualization solutions CUT THIS SLIDE
CUT THIS SLIDE
50. 50 Semantic Zooming in LiveRAC LiveRAC semantic zooming:
provides an area-aware graphical representation
modifies the graphic to best fit the available space
does not increase or decrease polygon count, or scale a graphic linearly, but changes graphic attributes, and may change the graphic entirely
51. 51 SWIFT Limitations Visualizations for SWIFT only provide node-link and geographic views
These views are good for mapping physical relationships
Move words back to previous page
Move words back to previous page
52. 52 SWIFT Architecture To provide streaming, real time capabilities, LiveRAC uses a client-server architecture
To provide streaming, real time capabilities, LiveRAC uses a client-server architecture
53. 53 LiveRAC handles rows and columns differently Large number of rows in a typical data view (thousands)
Comparatively small number of columns (dozens)
54. 54 Performance Requirements LiveRAC must maintain interactive frame rates while modifications to the grid are taking place
We need to draw guaranteed visible zones first to provide landmarks
The system needs to scale to thousands of devices, and tens of categories of monitored alarms & metrics
The system must support a large number of data points for alarms & metrics
Interactive frame rate would generally be considered 10fps!
Interactive frame rate would generally be considered 10fps!
55. 55 Split Line Performance
56. 56 Charting Performance System: 3Ghz Pentium-IV
Chart: 3 data series, 100 points each series
First draw: ~50ms
Subsequent redraws after modification: <5ms
Redraw from cached OpenGL display list: <1ms
57. 57 Statistical Graphics * Examples of statistical graphcis* Examples of statistical graphcis
58. 58 LiveRAC Visual Encoding Matrix view
rows of devices
columns of metrics and alarms: time-series objects
a cell contains a representation for a set of values of any time-series object
at highest density, cells are colored boxes
at lower densities cells can contain text, or graphical representations
59. 59 Accordion Drawing Split Line Structure Describe a split line
Tie in related work to our own where possible
Describe a split line
Tie in related work to our own where possible
60. 60 Accordion Drawing Split Line Structure Describe a split line
Tie in related work to our own where possible
Describe a split line
Tie in related work to our own where possible
61. 61 Static Split Lines Previous accordion drawing implementations used static, ordered lists of split lines
Insert, remove and reorder operations were O(n)
As with any list
As with any list
62. 62 Dynamic Split Lines Dynamic split lines are required for maintaining interactive frame rates while adding/removing rows or columns to the matrix
Client-server streaming architecture implies that new devices, alarms and metrics will be a common occurrence
Dynamic split lines support reordering of data
In the future, direct user modification of the data set can be supported
63. 63 Dynamic Split Line Requirements Requirements:
Worst case logarithmic insert and remove operations
O(log n) worst case path to any node from the root
Linear scalability in memory usage
Support for arbitrary ordering with enumeration
Can we use a red-black tree?
Red-black trees address the first three requirements
How can we avoid re-enumeration of keys if we allow nodes to be manipulated arbitrarily?
Describe WHY these requirements are the case!
Describe WHY these requirements are the case!
64. 64 Dynamic Split Lines: Solution
65. 65 Reordering Rows and Columns: Implementation For rows, we can swap pointers from split lines to devices without changing the split line structure
O(1)
Preserves layout topology
For columns, we use a global ordering list, mapping a bundle/metric/alarm name to an index number, changes to this list affects rendering of all columns
A hash map is maintained to back map column name to index numbers for O(1) lookups during rendering, this must also be fixed during a reorder
Swapping columns is O(c), where c is the number of columns, typically < 100
Do we need to talk about the fact that we have no column objects, only row objects? Aieee.
Do we need to talk about the fact that we have no column objects, only row objects? Aieee.
66. 66