Download
1 / 1
70 likes | 417 Views
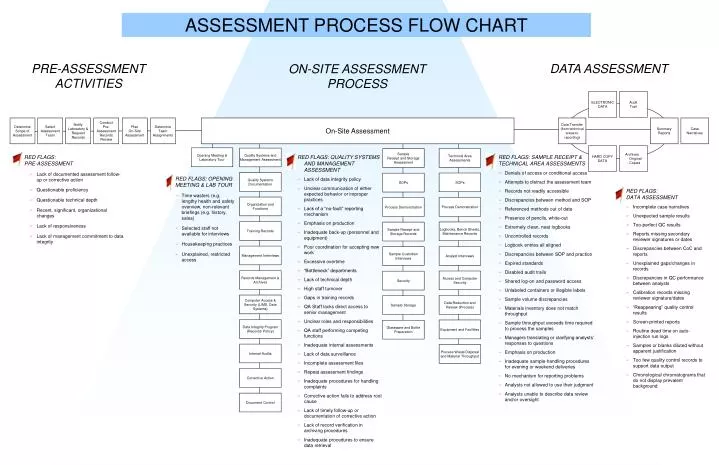
Opening Meeting & Laboratory Tour. Quality Systems and Management Assessment. Technical Area Assessments. Sample Receipt and Storage Assessment. Quality Systems Documentation. SOPs. SOPs. RED FLAGS: PRE-ASSESSMENT Lack of documented assessment follow-up or corrective action

E N D
Opening Meeting & Laboratory Tour Quality Systems and Management Assessment Technical Area Assessments Sample Receipt and Storage Assessment Quality Systems Documentation SOPs SOPs RED FLAGS: PRE-ASSESSMENT • Lack of documented assessment follow-up or corrective action • Questionable proficiency • Questionable technical depth • Recent, significant, organizational changes • Lack of responsiveness • Lack of management commitment to data integrity Organization and Functions Process Demonstration Process Demonstration RED FLAGS: QUALITY SYSTEMS AND MANAGEMENT ASSESSMENT • Lack of data integrity policy • Unclear communication of either expected behavior or improper practices • Lack of a “no-fault” reporting mechanism • Emphasis on production • Inadequate back-up (personnel and equipment) • Poor coordination for accepting new work • Excessive overtime • “Bottleneck” departments • Lack of technical depth • High staff turnover • Gaps in training records • QA Staff lacks direct access to senior management • Unclear roles and responsibilities • QA staff performing competing functions • Inadequate internal assessments • Lack of data surveillance • Incomplete assessment files • Repeat assessment findings • Inadequate procedures for handling complaints • Corrective action fails to address root cause • Lack of timely follow-up or documentation of corrective action • Lack of record verification in archiving procedures • Inadequate procedures to ensure data retrieval RED FLAGS: SAMPLE RECEIPT & TECHNICAL AREA ASSESSMENTS • Denials of access or conditional access • Attempts to distract the assessment team • Records not readily accessible • Discrepancies between method and SOP • Referenced methods out of date • Presence of pencils, white-out • Extremely clean, neat logbooks • Uncontrolled records • Logbook entries all aligned • Discrepancies between SOP and practice • Expired standards • Disabled audit trails • Shared log-on and password access • Unlabeled containers or illegible labels • Sample volume discrepancies • Materials inventory does not match throughput • Sample throughput exceeds time required to process the samples • Managers translating or clarifying analysts’ responses to questions • Emphasis on production • Inadequate sample-handling procedures for evening or weekend deliveries • No mechanism for reporting problems • Analysts not allowed to use their judgment • Analysts unable to describe data review and/or oversight RED FLAGS: OPENING MEETING & LAB TOUR • Time wasters (e.g. lengthy health and safety overview, non-relevant briefings (e.g. history, sales) • Selected staff not available for interviews • Housekeeping practices • Unexplained, restricted access RED FLAGS: DATA ASSESSMENT • Incomplete case narratives • Unexpected sample results • Too-perfect QC results • Reports missing secondary reviewer signatures or dates • Discrepancies between CoC and reports • Unexplained gaps/changes in records • Discrepancies in QC performance between analysts • Calibration records missing reviewer signature/dates • “Reappearing” quality control results • Screen-printed reports • Routine dead time on auto-injection run logs • Samples or blanks diluted without apparent justification • Too few quality control records to support data output • Chronological chromatograms that do not display prevalent background Training Records Logbooks, Bench Sheets, Maintenance Records Sample Receipt and Storage Records Management Interviews Analyst Interviews Sample Custodian Interviews Records Management & Archives Access and Computer Security Security Computer Access & Security (LIMS, Data Systems) Data Reduction and Review (Process) Sample Storage Data Integrity Program (Records/ Policy) Equipment and Facilities Glassware and Bottle Preparation Internal Audits Process Waste Disposal and Material Throughput Corrective Action Document Control ASSESSMENT PROCESS FLOW CHART PRE-ASSESSMENT ACTIVITIES DATA ASSESSMENT ON-SITE ASSESSMENT PROCESS ELECTRONIC DATA Audit Trail Determine Scope of Assessment Select Assessment Team Notify Laboratory & Request Records Conduct Pre-Assessment Records Review Plan On-Site Assessment Determine Team Assignments On-Site Assessment Data Transfer (from technical areas to reporting) Summary Reports Case Narratives Archives - Original - Copies HARD COPY DATA