Download
1 / 58
590 likes | 774 Views
CHILD NUTRITION CHALLENGES AND OPPORTUNITIES Prema Ramachandran Director, Nutrition Foundation of India. Major nutrition-related public health problems Chronic energy deficiency and undernutrition Micro-nutrient deficiencies

E N D
CHILD NUTRITION CHALLENGES AND OPPORTUNITIES Prema Ramachandran Director, Nutrition Foundation of India
Major nutrition-related public health problems • Chronic energy deficiency and undernutrition • Micro-nutrient deficiencies • Anaemia due to iron and folate deficiency • Vitamin A deficiency • Iodine Deficiency Disorders • Chronic energy excess and obesity
Low birth weight – why is it remaining unchanged • Why are we unable to ensure • Exclusive breast feeding for the first six months • Timely appropriate & adequate complementary feed • What is responsible for low dietary intake and high under-nutrition rates in preschool child • What can we do to reduce anaemia in children • Massive dose Vit A -Where do we go now ? • Can we achieve universal access to iodised salt by 2010 • What should we do to tackle over- nutrition • What are the priority areas for R&D
Low birth weight Why is it remaining unchanged What is its impact on IMR What happens to growth and development -are our children short , thin but fat ? What are the long term implications of low birth-weight and low growth trajectory
Trends in Low Birth Weight Mean Gest ? 0.8W 0.3W 0 0.7W 20-15% 14-10% Preterm 21-16% 74g Mean Wt 78g 52g 126g ? 1988 1962 1969 1969-73 1986 1989-93 1995 1994
Multicentric Data • National Neonatology Forum (1995/ 2002) Institutional Data on 37082 / 66512 Births LBW - 33% /31.6% VLBW - 3.3% /3.3% Preterm - 12.3% /14.7% • ? Overestimates: Underprivileged and High Risk Population
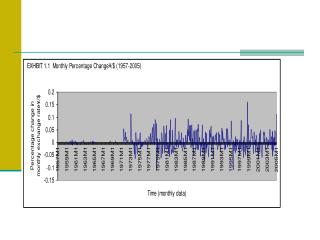
Time trends in IMR Source: RGI 2002
Over the last three decades there is no significant change in mean birth weight or incidence of LBW However there has been a steep decline in IMR If IUGR is major cause of LBW improvement in BW is not essential prerequisite for reduction in IMR
Birth weight and health • In India about one third of all infants weigh less than 2.5 kg at birth. • Low birth weight is associated with • Low growth trajectory • ?Increased risk of obesity, diabetes and coronary heart disease in later life
Child nutrition begins with maternal nutrition
Birth weights in relation to maternal BMI Source: Tenth Five Year Plan 2002
Improving maternal nutrition • During the Tenth Plan efforts will be made to weigh all women as early in pregnancy as possible and to monitor their weight gain • This is not being done at the national level • Under the ICDS programme, food supplements are being provided to pregnant and lactating women who come to anganwadis. • Coverage is between 15 and 20% • Women who receive supplements are not being chosen on the basis of their nutritional status
Tenth Plan strategy • Operationalising universal antenatal care for all pregnant women • ANC coverage is low ; content suboptimal Majority do not get weighed ; very few get Hb estimation done (NFHS -DLHS data). • Operationalisation of nutrition interventions for the management of under-nutrition through: • targeted food supplementation and health care for those with under-nutrition • Appropriate management of anaemia non existent
Tenth Plan -Improving maternal nutrition Women who weigh < 40 kg should be identified and • given food supplements consistently throughout pregnancy; • given adequate antenatal care; • monitored for weight gain during pregnancy and, if weight gain is sub-optimal, identify the causes and attempt remedial measures; and • given appropriate antenatal, intrapartum and postpartum care. • Under NPAG in 51 poor districts • all pregnant women were weighed • those weighing <40 kg given 6 kg of food grains/month • Reported coverage high –cost low • Programme is getting evaluated
Low birth weight –10 Plan strategy • anganwadi workers to report all births in village, • weigh all neonates delivered at home soon after birth and • refer those weighing less than 2.2 kg to a hospital with a pediatrician. • Current status • Feasibility demonstrated in small studies • Anganwadis should have a 10kg tubular Salter scale for reasonably accurate weighing of neonate • Need to have information about nearest hospital with a pediatrician • Unfinished agenda - action will help in NNMR
Over two decades there has been an increase in fat fold thickness of neonates in boys and girls in all birth weight categories
Over two decades there has been an increase in fat fold thickness of neonates in boys and girls in all gestational age categories
Birth weight, plasma glucose and insulin concentrations in 4-year old urban children Source: Yagnik et al, 1998
Time Trends in nutritional status of Delhi cohort Source: Bhargava et al, 2004
Current Status of Delhi cohort Source: Bhargava et al, 2004
Breast feeding – protection from under and over nutrition How far have we succeeded in protection and promotion of breast feeding Emerging challenges
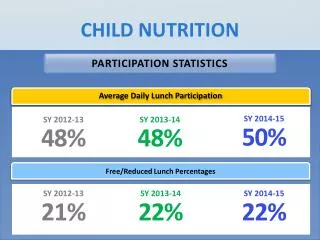
Infant feeding practices -NFHS -2 Source: NFHS 1998-99 Breast feeding is universal in India but exclusive breast feeding upto six months and introduction of complementary feeds at six months is not common
Prevalence of undernutrition (Weight for age % below -2 SD) Source: NFHS 1998-99 As a result there is steep increase in under nutrition between 6-23 months of age
Tenth Plan- major focus on Prevention of undernutrition in infancy through • promotion of exclusive breast feeding in the first six months; • nutrition education for the introduction of appropriate low-cost, energy dense (home available) complementary food at 6 months ; • focus on nutrition education by AWW/ ANM during each contact. Yet to be operationalised under ICDS /NRHM • Needed clear crisp messages; AWW to district doctor should all say the same things repeatedly to bring about behavioral change • Use of mass media as in NRHM - will it help in bring uniformity in messages of health and ICDS workers ?
The goals for the Tenth Plan are to • enhance early initiation of breast-feeding (colostrum feeding) from the current level of 15.8 per cent (as per NFHS 2) to 50 per cent; • enhance the exclusive breast-feeding rate for children up to the age of six months from the current rate of 55.2 per cent (as per NFHS 2) to 80 per cent; • enhance the complementary feeding rate at six months from the current level of 33.5 percent (as per NFHS 2) to 75 per cent. • Available data from DLHS and BPNI surveys indicate that these goals will not be achieved • Operationalisation of this component should get major attention during 11th Plan
Under nutrition in Preschool children Role of poverty and poor caring practices Screening , early detection and effective management can change the scenario
Time Trends in Energy intake and undernutrition in children (1-3 years) Source: NNMB reports Even though there is no increase in energy intake over time there has been a decline in severe undernutrition perhaps because of better access to health care
Nutritional Status of children by Income Source: NFHS 1998-99 Undernutrition rates among poor in Kerala are similar to undernutrition rates among the rich in UP. Appropriate IYCF and caring can lead to steep fall in undernutrition rates in preschoolers
Mean Energy Consumption- NNMB 2000 The gap between RDA and the actual energy intake is greatest in preschool children and lowest in adults Poor caring practices rather than poverty appear to be the major factor for low energy intake in children
Over years there has been a increase in the number of households where adults are getting adequate food but children are not; this confirms that poor child feeding and caring practices rather than poverty is becoming the common cause of of undernutrition in preschool child
Over years there has been a decline in severe under nutrition ( weight for age and height for age) but not in wasting ( weight for height). Health implications of wasting are not well documented Does low wasting rate explain the South Asian paradox ?
Energy Intake (INP) & Undernutrition among children (NFHS II) Higher dietary intake will not lead to better child nutrition unless infections are controlled
% of severe underweight(<4yrs) and under-5 mortality rate Source: NFHS 1998-99
Nutritional Status of children by Income Source: NFHS 1998-99
Tenth Plan Goals Reduce prevalence of • severe undernutrition in children in 0-6 age group by 50% • Mild and moderate under-nutrition from current level of 47%to 40% Tenth Plan recommended strategies for reduction of undernutrition have not been operationalised Available data from DLHS show that there is no major reduction in undernutrition since 1998-99. BUT Projects in Orissa, WB ,MP has demonstrated that if the suggested strategies are followed these goals are achievable with in the existing constraints
Capacity building in ICDS: Tenth Plan • enhancing the quality and impact of ICDS substantially through training, supervision of the ICDS personnel and improved community ownership of the programme; • concentrating on the improvement of the quality of care and inter-sectoral coordination and strengthening nutrition action by the health sector; • creating nutrition awareness through IEC at all levels (community, women’s group, village-level workers, PRIs, programme managers and policy makers at the state and central levels); and • establishing a reliable monitoring and evaluation mechanism • Yet to be operationalised; should receive priority
Convergence of services • AWW can • weigh neonates in home deliveries and refer those requiring care • advise regarding exclusive breast feeding and complementary feeding • identify undernourished pre-school children by weighing them at least once every three months and give food on priority to them; • act as depot holder for ORS. • assist in emergency referral
Convergence of services • ANM will • Immunize all infants, pregnant women and children as per schedule. • Screen children – especially the under nourished ones for health problems and manage/ refer those with problems. • AWW will • Assist ANM in organizing immunization health check ups in anganwadi; • Assist ANM in administering massive dose Vitamin A
Micronutrient deficiencies All effort for combating anaemia Review Vitamin A supplementation Universal access to iodised salt
Anaemia is a major problem right from childhood; it worsen during adolescence in girls Advent of pregnancy further aggravates anaemia
Combating anaemia Promote breastfeeding, improve complementary feeding Dietary diversification Double fortified salt Screen all children where ever possible – school health, hospitals OPDs Detect and treat anaemia vigorously
Vitamin A Deficiency • Clinical Deficiency Marked Reduction • Blindness: 2% (1974) to 0.04% (1985) • Bitot Spots: ICMR (1969) – 4.2% DWCD (1996) – 0.21% NNMB: 2% (1996), 0.7% (1990 & 1997) • Isolated Areas – Bihar, UP (DNP-ICMR 01’) • Night Blindness (<4 yr) MICS 2000: 0.6%
Coverage Under Massive dose of Vitamin A Coverage can be improved -Orissa, UP But overall coverage remains low
Prevalence of Bitot spot has declined Is this the right time to review the massive dose vitamin A programme ?
Huge installed capacity for producing iodised salt This is under utilised. We supply iodised salt to other countries who attain high rates of iodised salt use
Many coastal , salt manufacturing states with good health indices have low iodised salt use. Prevalence of goitre in these non endemic states is relatively high
There was a decline in household access to iodised salt after the ban on sale of non- iodised salt was lifted Reimposition of ban is under way
Tenth Plan strategy • Promotion of appropriate dietary intake and lifestyles for the prevention and management of obesity and diet-related chronic diseases • Nutrition monitoring and surveillance to enable the country to track changes in the nutritional and health status of the population to ensure that: • existing opportunities for improving nutritional status are fully utilized; and • emerging problems are identified early and corrected expeditiously.
Tenth Plan strategy Research efforts to be directed towards: • review of the recommended dietary intake of Indians; • building up of epidemiological data on: • relationship between birth weight, survival, growth and development in childhood and adolescence; • body mass index norms of Indians and health consequences of deviation from these norms.