Download
1 / 38
400 likes | 1.13k Views
Financial Management Case Study: Risk & Return. The Battle for Value: FedEx v.s. UPS. NCCU EMBA 2004, Fall. 小組成員介紹. Financial Management Case Study: Risk & Return. NCCU EMBA 2004, Fall. Fact of 1995. FedEx & UPS dominated 19 billion air-express market

E N D
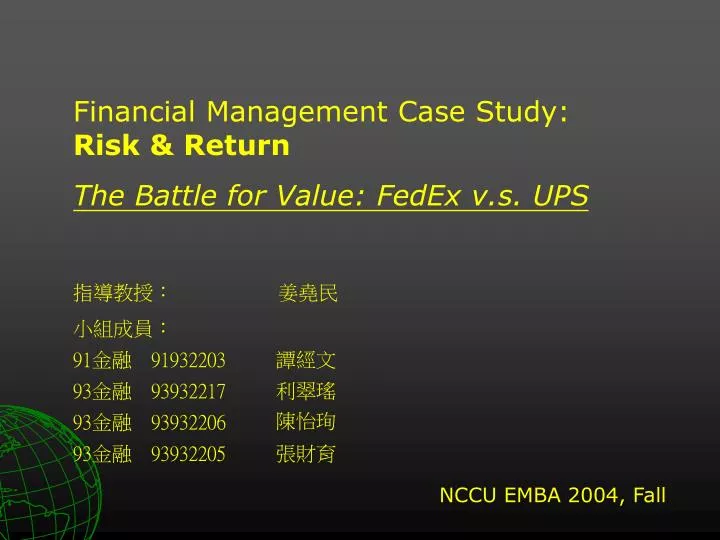
Financial Management Case Study: Risk & Return The Battle for Value: FedEx v.s. UPS NCCU EMBA 2004, Fall
小組成員介紹 Financial Management Case Study: Risk & Return NCCU EMBA 2004, Fall
Fact of 1995 • FedEx & UPS dominated 19 billion air-express market • 1995年7月10日J.C. Penny宣佈與UPS簽定一紙價值10億美金的五年運送合約 • 這一項宣布讓FedEx股價下跌2.33%,市值減少$85m. • 對強調品質與創新的FedEx(1)而言,是否意味傳統上被認為大型而僵化的UPS,將成為其主要競爭者? (1).1990獲得Malcolm Baldgrige國家品質獎
Market Challenge at 1995 • Intensifying efforts at products innovation, quality, and reengineering • High and rising investment in the business • Shift market share
“father of the overnight delivery business”…. • Known as the "father of the overnight delivery business" • The Marine Corps veteran who teetered on the verge of bankruptcy is one of American business's greatest success stories Fred Smith Founder, Chairman and CEO of Federal Express Corporation
Appendix Exhibit 1.2 Some Key Financial Ratio, 1994
Risk & Return Appendix exhibit 7 Compare Annual Return Net Cumulative Return with S&P 500
Risk & Return * Assumption Rf= 7.43% (30 year US G. bond rate of 1994)
Risk & Return • Top down Beta vs. Bottom up Beta • VaR = Pclose.Volatility().C.L.* *95%:1.645 ;99%:2.236 Appendix Exhibit 7 Appendix Exhibit 9,10
Return on Invested Capital NOPAT/Invested (beginning) Capital Appendix Exhibit 9,10
WACC WACC= E/V * Re + D/V * Rd(1-Tc) Re : cost of equityRd : cost of debtE : market value of equityD : market value of debtTc : tax rate V : D+E Appendix Exhibit 9,10 Assumption Risk Premium: 5.4% Cost of Invested Capital
Net Return on Invested Capital EVA: NOPAT- (Invested Capital x Cost of Capital) Economic Value Added
Appendix Exhibit 9,10 Market Value Added
75% FedEx 的股票為法人持有,咸信分析師的看法對股價會有影響,以下是1995年中一些分析師對FedEx 的看法• • • 『FedEx股價近期的弱勢,對我們來說像是一種普遍大眾對經濟及對航空快遞市場的關注。 • • •也使得憂心FedEx可能沒有辦法藉由提高價格來扭轉國內所得的減少。而近期美日貿易緊張局勢• • •可能給投資人增加持股的憂慮。 • • •我們維持對FedEx股價低於市場表現(underperformance)的評等• • • 。』 『 FedEx國內營運的利潤下降, FedEx正在努力調整利潤下降的業務。我們期盼1996年問題能有所改善• • • ,同時,國際的部分正在逐漸增強• • • ,空運業也正努力的開發進入廣大的亞洲市場。以FedEx逐漸全球化的網絡為基礎,評等中立(neutrally ranked)的FedEx股票• • • 『國內市場的表現讓人失望 • • •國內營運的利潤從去年的6.7%被縮減到4. 2%。生意轉向低單價運送業務需要更快的成本節省是高於其能力的• • • 我們正在提高其未來的評價,因為國際市場的表現我們預期能繼續抵銷其國內營運收入的惡化。對於FedEx我們持續給普通股評價 買進(Buy)。』
It seems Better than But …
What nowadays ? versus
The Express Industry(1) • DHL, FedEx, TNT & UPS represent 85% of industry • $70 billion revenues • In excess of 4.5 billion annual shipments • 635,000 people • 1500 aircraft • Operate in 220 countries (1). Best Practice and Benchmarks: A Workshop With the Royal Customs Malaysia Kuala Lumpur Dec. 2-3, 2003 Irma Hardjasatya (FedEx Express)
Intl Air Express Shipment Growth DHL remains the leading international express company with about a 33% market share, followed by FedEx (21% share), UPS (18% share), TNT (12% share) and EMS (7% share).
U.S. Domestic Air Express Industry • Overall revenues for the U.S. domestic air freight and express industry in 2003 totaled $27.8 billion, a figure that was up about 2% from 2002. • The integrated express companies (FedEx, UPS, DHL/Airborne, Menlo Forwarding and BAX Global) as a group generated $25 billion (90%) of the industry’s total revenue in 2003. • DHL’s acquisition of Airborne Express in August 2003 dramatically altered the landscape of the U.S. air express business. • Estimates that DHL now has an 18.4% share of the U.S. domestic air express market(see table below), however it will only be able to grow by taking business from FedEx and UPS. • In fact, the slow growth in demand for air express services means that the main competitors in the U.S. market are seeking to expand their surface delivery capabilities, and to generate more business in the growing international express sector.
Domestic Market Share Note: Data represent purely domestic traffic only. Source: Air Cargo Management Group research as contained in the U.S. Domestic Air Freight Express Industry Performance Analysis, 2004
Established in 1973 • FedEx Co. Common stock is listed on the NYSE • 17,901 shareholders as on 7/12, 2004 • 235,000 employees • Distribution to 215 countries with 645 aircraft and 84,000 vehicles • Total revenue in 2003 was over $24 billion • Credit Rating “BBB”, outlook stable, S&P Ratings Services, 2004
Founded in 1907 • 355,000 employees,12/31, 2003 • Class A common stock is not listed on any securities exchange • Class B common stock is listed on the NYSE • As of February 28, 2004, there were 169,751 and 14,409 record holders of Class A and Class B stock, respectively • In 2003, an average of more than 13 million pieces per day throughout the United States and in over 200 other countries and territories • The 9th largest airline in North America and 11th largest in the world • Total revenue in 2003 was over $33 billion • Credit rating AAA/Aaa from Standard and Poor's and Moody's, respectively
a $3 trillion worldwide market… "At its core, synchronized commerce is about getting the right goods, to the right place, at the right time and in the right physical and financial condition. It’s not just a process. It’s an emerging industry space – a $3 trillion worldwide market. " Michael L. Eskew Chairman and Chief Executive Officer • Purdue University with a bachelor's degree and completed the Advanced Management Program at the Wharton School of Business. • Began his UPS career in 1972 as an industrial engineering manager in Indiana. • Eskew held this position on January 1, 2002.
International Revenue/Total Revenue 27%/1994 25%/2003 GEOGRAPHICAL INFORMATION
International Revenue/Total Revenue 12%/1994 17%/2003 GEOGRAPHICAL INFORMATION
Risk & Return *Assumption Rf= 4.91% (30 year US G. bond rate of 2004 10.1) **Data:2001.10~2004.9
Assumption : Equity Risk Premium: 5.4% Risk Premium BBB :1.79% Risk Premium AAA :0.53% Cost of Invested Capital, 2003 WACC Appendix Exhibit 9,10
Malcolm Baldrige National Quality Award • The Malcolm Baldrige National Quality Award signed by Ronald Reagan into law on August 20, 1987. • To amend the Stevenson-Wydler Technology Act of 1980 with the objective of encouraging American business and other organizations to practice effective quality control in the provision of their goods and services. • Foundation for the Malcolm Baldrige National Quality Award, established in 1988. The Award is named for Malcolm Baldrige, who served as Secretary of Commerce from 1981 until his tragic death in a rodeo accident in 1987. His managerial excellence contributed to long-term improvement in efficiency and effectiveness of government. • In 1990,Cadillac, IBM Rochester, Wallace & FedEx received the honor
Calculating Economic Profit Economic Value Added Economic Value Added (EVA) is a financial performance method to calculate the true economic profit of a corporation. EVA can be calculated as net operating after taxes profit minus a charge for the opportunity cost of the capital invested. EVA is an estimate of the amount by which earnings exceed or fall short of the required minimum rate of return for shareholders or lenders at comparable risk. Unlike Market-based measures, such as MVA, EVA can be calculated at divisional (Strategic Business Unit) level. Unlike Stock measures, Economic Value Added is a flow and can be used for performance evaluation over time. Unlike accounting profit, such as EBIT, Net Income and EPS, EVA is Economic and is based on the idea that a business must cover both the operating costs AND the capital costs. Usage of the EVA method Economic Value Added (EVA) can be used for the following purposes: - setting organizational goals - performance measurement - determining bonuses - communication with shareholders and investors - motivation of managers - capital budgeting ( news on budgeting) - corporate valuation Calculating EVA Net Sales - Operating Expenses ------------------------------ Operating Profit (EBIT) - Taxes ------------------------------ Net Operating Profit After Tax (NOPAT) - Capital Charges (Invested Capital x Cost of Capital) ------------------------------Economic Value Added (EVA)
Calculating MVA Market Value Added (MVA) is the difference between the equity market valuation of a listed/quoted company and the sum of the adjusted book value of debt and equity invested in the company. In other words it is the sum of all capital claims held against the company; the market value of debt and the market value of equity. The higher the Market Value Added (MVA), the better.A high MVA indicates the company has created substantial wealth for the shareholders. MVA is equivalent to the present value of all future expected EVAs. Negative MVA means that the value of the actions and investments of management is less than the value of the capital contributed to the company by the capital markets. This means that wealth or value has been destroyed. Note: the aim is to maximize MVA, NOT to maximize the value of the firm, since this can be easily accomplished by investing ever-increasing amounts of capital Note: MVA does NOT take into account the opportunity costs of the invested capital. Note: MVA also does NOT take into account intermediate cash returns to shareholders. Note: Market Value Added (MVA) can not be calculated at divisional (Strategic Business Unit) level and can not be used for private held companies. Formula Market Value Added (MVA) = market value - invested capital.