Download
1 / 22
220 likes | 352 Views
EUROPEAN FUND FOR THE INTEGRATION OF THIRD COUNTRY NATIONALS PAN-EUROPEAN CONFERENCE Work: A Tool for Inclusion or a Reason for Exclusion?. Integration Indexes of Third Country Nationals Methodological Contributions Gian Carlo Blangiardo Milano-Bicocca University / Ismu Foundation.

E N D
EUROPEAN FUND FOR THE INTEGRATION OF THIRD COUNTRY NATIONALS PAN-EUROPEAN CONFERENCE Work: A Tool for Inclusion or a Reason for Exclusion? Integration Indexes of Third Country Nationals Methodological Contributions Gian Carlo Blangiardo Milano-Bicocca University / Ismu Foundation Gian Carlo Blangiardo
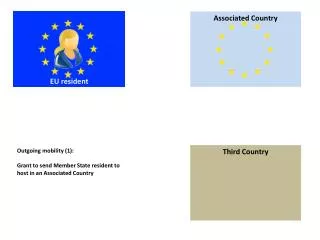
The ultimate purpose to measure and compare integration level among migrant populations (or sub-populations defined according to some specific features) Gian Carlo Blangiardo
The classical macro approach:by statistical indicators of integration Gian Carlo Blangiardo
European Core Indicators of Migrant Integration • 1) Employment • Employment rate • Unemployment rate • Activity rate • Over-qualification rate • Self-employment rate • 2) Education • Highest educational attainment • Share of low-achieving 15-year-olds in reading, mathematics and science • Share of 30–34-year-olds with tertiary educational attainment • Share of early leavers from education and training • 3) Social inclusion • Median disposable income • At-risk-of-poverty-or-social-exclusion rate (before and after social transfers) • Share of population perceiving their health status as good, fair, or poor • Ratio of property owners to non-property owners • 4) Active citizenship • Share of immigrants that acquired citizenship • Share of immigrants with permanent or long-term residence, currently only EC long-term residence • Share of immigrants among elected representatives Gian Carlo Blangiardo
Unemployment rate of persons aged 25-54 by groups of country of birth, gender and highest level of educational attainment, EU-27, 2008 (%) Gian Carlo Blangiardo
Over-qualification rate differences between foreign-born and native-born tertiary educated persons aged 25-54, 2008 (%) Gian Carlo Blangiardo
Macro data from statistical sources duly processed to produce indicators WE NEED • Labour Force Survey • EU Statistics on Income and Living Conditions • Census data • OECD PISA Survey • Etc. Main sources Gian Carlo Blangiardo
The alternative micro approach: by individual scores of integrationVery apt to investigate differential aspects of the integration corresponding to local areas or to specific sub-populations& to control the effects of local or targeted policies Gian Carlo Blangiardo
Individual data-base from statistical surveys duly processed WE NEED • 1) Representative samples of the target population • 2) A methodology able to assign an integration score, according to a preliminary definition of integration, to every statistical unit of the sample Gian Carlo Blangiardo
AS REGARDS METHODS TO HAVE a representative samples of the target populations see: Baio G., Blangiardo G.C. and Blangiardo M., Centre Sampling Thecnique in Foreign Migration Surveys, Journal of Official Statistics, Vol.27, No.3, 2011, pp.451-465. And for its numerous applications since early 90s www.ismu.org ORIM – Regional Observatory for Integration and Multiethnicity Gian Carlo Blangiardo
HOW TO assign an integration score, according to a preliminary definition of integration, to every statistical unit of the sample ? the following steps are required REMARK In this example we shall consider the sole topic of labor market integration of TCNs. Anyway a similar the procedure can be followed in order to assign individual integration scores regarding both other specific dimensions (education, social exclusion, etc.) and the integration level as a whole Gian Carlo Blangiardo
A new approach to measure integration:by individual integration scores Step 1 Step 2 Step 3 Step 4 Step 5 Step 6 STEP1 Selection of a set of indicators according to a definition of integration in the labor market STEP2 Choice of the variables of sample dataset available to give the requested indicators STEP3 Identification of integration scores by processing the frequencies of the sample distribution of the variables selected STEP4 Assignment the scores to each statistical unit according to its modality of the variables under consideration STEP5 Attribution of the average score of integration at each statistical unit (additive variable to the sample dataset) STEP6 Processing the integration score together with structural data (personal features, education, social inclusion, etc.) Gian Carlo Blangiardo
Example of the application of the procedure 7 Steps 1&2 Definition: “a migrant who is employed with a stable/secured job that gives good income and is adequate to his education level can be considered fully integrated into the labor market” Source: PerLa Survey 2009 - Percorsi Lavorativi (Labor Path)13,006 sample units; Target population: migrants living in Italy who have or had a legal job since 12 months before the survey Methodology: Centre sampling Gian Carlo Blangiardo
Step 3 8 Identification of integration scores by processing the frequencies of the sample distribution of the variables selected Gian Carlo Blangiardo
Step 3 (cont’d) 8 Gian Carlo Blangiardo
Step 3 (cont’d) 8 For each modality the corresponding score is obtained through the difference between the sum of the previous frequencies (relative) less the sum of the following ones. It can be remarked that, for any variable, the mean score for the whole set of sample units will be zero. Gian Carlo Blangiardo
Set of scores(for each of the 4 dimensions) Gian Carlo Blangiardo
Steps 4 & 5 Assignment the scores to each statistical unit according to its modality of the variable under consideration (total 13,006 units) & Average of the 4 partial scores (Final Mean score) Gian Carlo Blangiardo (*) Present or last job
Step 6Processing the integration score together with structural data (personal features, education, social inclusion, etc.) 11 Integration Index: mean scores by dimensions and gender Source: Ismu-PerLa 2009 Gian Carlo Blangiardo
Step 6 (cont’d)Processing the integration scores together with structural data (personal features, education, social inclusion, etc.) 11 Integration Index: final mean scores by year of arrival to Italy and gender Source: Ismu-PerLa 2009 Gian Carlo Blangiardo
Additional remark Positive integration scores seem to be associated to better work conditions Source: Ismu-PerLa 2009 Gian Carlo Blangiardo