Download
1 / 29
1.28k likes | 3.47k Views
United Kingdom Prospective Diabetes Study (UKPDS) . United Kingdom Prospective Diabetes Study (UKPDS): Index to slides. 14. Risk reduction 15. Quality of life assessment measures 16. Quality of life 17. Conclusions 18. Metformin study: Risk reduction

E N D
United Kingdom Prospective Diabetes Study (UKPDS): Index to slides 14. Risk reduction 15. Quality of life assessment measures 16. Quality of life 17. Conclusions 18. Metformin study: Risk reduction 19. Sulphonylurea inadequacy: Overview 20. Sulphonylurea inadequacy: HbA1c 21. Sulphonylurea inadequacy: Summary 22. BP control study: Goals 23. BP control study: Management 24. BP control study: Results 25. BP control study: Risk reduction 26. Relationship between endpoints and HbA1c or BP 27. Implications 1. Goals 2. Overview 3. Design 4. Conventional management regimen 5. Intensive management regimen 6. Clinical endpoints 7. Therapy progression 8. Effects of management on HbA1c 9. Effects of management on FPG 10. Effects of management on body weight 11. Effects of management onmyocardial infarction 12. Effects of management on microvascular endpoints 13. Effects of management on hypoglycaemia
UKPDS: Goals • Primary goal: to determine the effect of intensive blood glucose control (pharmacological management) versus conventional blood glucose control (lifestyle changes) on the development of macrovascular and microvascular complications in Type 2 diabetes • Secondary goal: to determine if a particular therapy for glycaemic control (insulin, sulphonylureas, or metformin) has any advantages or disadvantages UKPDS Group. Lancet. 1998;352:837–853.
UKPDS: Overview • 20-year, multicentre, prospective, randomised, intervention trial • 5102 people with newly diagnosed Type 2 diabetes • FPG >6 mmol/l (108 mg/dl) • Mean follow-up: 11 years UKPDS Group. Lancet. 1998;352:837–853.
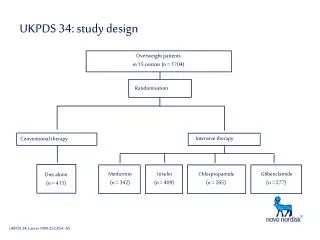
UKPDS: Design 3 month run-in period Diet management regimen (n=5102) Randomisation (n=4209) Metformin treatment Overweight patients (n=342) Non-overweight and overweight patients (n=3867) Conventional management (n=1138) Intensive management (n=2729) Sulphonylurea treatment (n=1573) Insulin treatment (n=1156) UKPDS Group. Lancet. 1998;352:837–853.
UKPDS: Conventional management regimen (lifestyle changes) • Primary management: diet • Treatment goal • near-normal body weight • FPG <15 mmol/l (270 mg/dl) • premeal glucose 4–7 mmol/l (72–126 mg/dl; insulin only) • Management if hyperglycaemia or hyperglycaemic symptoms develop: • nonintensive pharmacological therapy (sulphonylurea or insulin; metformin if overweight) UKPDS Group. Lancet. 1998;352:837–853.
UKPDS: Intensive management regimen (pharmacological management) • Primary management • sulphonylurea (500 mg/day chlorpropamide) or 20 mg/day glibenclamide • insulin (daily injection with intermediate- or long-acting insulin) • self-monitoring of blood glucose • Treatment goal • FPG<6 mmol/l (108 mg/dl) • premeal glucose 4–7 mmol/l (72–126 mg/dl; insulin only) • Management if hyperglycaemia or hyperglycaemic symptoms develop • sulphonyureas • add metformin; switch to insulin therapy if hyperglycaemia recurs • insulin single bedtime injection • initiate complex insulin regimen UKPDS Group. Lancet. 1998;352:837–853.
UKPDS: Clinical endpoints • Primary outcome measures = 21 clinical endpoints • Diabetes-related endpoints • myocardial infarction, heart failure, angina, sudden death, stroke, amputation, retinal photocoagulation, renal failure, vitreous haemorrhage • Non-diabetes-related endpoints • death from accident, cancer UKPDS Group. Lancet. 1998;352:837–853.
UKPDS: Therapy progression Conventional Policy (accept <15 mmol/l) Intensive Policy (aim for <6 mmol/l) 100 100 diet alone additional non-intensive 80 80 pharmacological therapy 60 60 Percentage of patients intensive 40 40 pharmacological therapy diet alone 20 20 0 0 1 2 3 4 5 6 7 8 9 10 11 12 1 2 3 4 5 6 7 8 9 10 11 12 Years from randomisation UKPDS Group. Lancet. 1998;352:837–853.
UKPDS: Effects of management on HbA1c 9 Conventional 8 HbA1c (%) Intensive 7 6.2% upper limit of normal range 6 0 0 3 6 9 12 15 Years from randomisation UKPDS Group. Lancet. 1998;352:837–853.
UKPDS: Effects of management on fasting plasma glucose 11.1 Conventional 10.0 8.9 Median FPG (mmol/l) Intensive 7.8 6.7 5.6 0 0 3 6 9 12 15 Years from randomisation UKPDS Group. Lancet. 1998;352:837–853.
UKPDS: Effects of management onbody weight 7.5 Intensive 5.0 Change in body weight (kg) 2.5 Conventional 0.0 -2.5 0 3 6 9 12 15 Years from randomisation UKPDS Group. Lancet. 1998;352:837–853.
UKPDS: Effects of management on myocardial infarction 30 Conventional 20 p=0.052 Percentage of patients with event 10 Intensive 0 0 3 6 9 12 15 Years from randomisation UKPDS Group. Lancet. 1998;352:837–853.
UKPDS: Effects of management on microvascular endpoints 30 20 p<0.01 Percentage of patients with event Conventional 10 Intensive Intensive 0 0 3 6 9 12 15 Years from randomisation UKPDS Group. 1998;352 Lancet. :837–853.
UKPDS: Effects of management on hypoglycaemia Any episode Major episodes 50 5 40 4 Intensive Intensive 30 3 Percentage of patients 20 2 10 1 Conventional Conventional 0 0 0 3 6 9 12 15 0 3 6 9 12 15 Years from randomisation UKPDS Group. Lancet. 1998;352:837–853.
Any diabetes-related endpoint 12 Diabetes-related deaths 10 Myocardial infarction 16 Microvascular disease 25 Retinopathy progression* 21 Cataract extraction 24 Microalbuminuria* 33 UKPDS: Risk reduction Risk reduction (%) * At 12 years UKPDS Group. Lancet. 1998;352:837–853.
UKPDS: Quality of life assessment measures • Generic questionnaire (EQ5D) • evaluates general health status • Specific questionnaire • evaluates relative burden of an intensive management regimen • 46 core items • 4 major dimensions • work satisfaction • mood disturbances (Profile of Mood State) • cognitive failures (Cognitive Failure Questionnaire) • symptoms experienced in the last week • 5- or 7-point Likert scale • 1 = no impact, no worries, always satisfied • 5 or 7= always affected, always worried, never satisfied UKPDS Study Group. Diabetes Care 1999;22:1125–1136.
UKPDS: Quality of life • Diabetes complications associated with poorer quality of life • Intensive insulin treatment regimen had no effect on quality of life UKPDS Study Group. Diabetes Care 1999;22:1125–1136.
UKPDS: Conclusions • Glycaemic control deteriorated with time regardlessof initial choice of therapy • Pharmacological glycaemic control (intensive group) reduced HbA1c by 0.9% over 10 years, with a resulting decrease in clinical complications • No significant reduction in macrovascular events with sulphonylureas or insulin therapy • Pharmacological management was associated with significant increase in weight versus lifestyle changes UKPDS Group. Lancet. 1998;352:837–853.
UKPDS metformin study in overweight patients: Risk reduction Risk reduction* (%) Sulphonylurea/ insulin intensive Metformin intensive Any diabetes-related end-point 32 7 Diabetes-related deaths 42 20 Myocardial infarction 39 21 Microvascular disease 29 16 * Compared with conventional therapy UKPDS Group. Lancet. 1998;352:854–865.
UKPDS sulphonyurea inadequacy : Overview • Primary goal: to evaluate the efficacy of the addition of insulin when maximal sulphonylurea therapy is inadequate in people with Type 2 diabetes • People with Type 2 diabetes were randomised to receive conventional management or intensive management regimen • Patients randomised to intensive management regimen received insulin if FPG <6 mmol/l (108 mg/dl) UKPDS Group. Diabetes Care. 2002;25:330–336.
UKPDS sulphonyurea inadequacy: HbA1c Conventional Intensive (insulin alone) 9 Intensive (sulphonylurea ± insulin) 8 HbA1c (%) 7 6 6.2% upper limit of normal range 5 0 0 1 2 3 4 5 6 Years from randomisation UKPDS Group. Diabetes Care. 2002;25:330–336.
UKPDS sulphonyurea inadequacy: Summary • HbA1c was significantly lower in the sulphonylurea ± insulin intensive management group compared with the insulin alone intensive management group • Weight gain was similar in both intensive management groups • Major hypoglycaemia occurred less frequently in the sulphonylurea ± insulin intensive management group compared with the insulin alone intensive management group • Early addition of insulin when maximal sulphonylurea therapy is inadequate can significantly improve glycaemic control without promoting increased hypoglycaemia or weight gain UKPDS Group. Diabetes Care. 2002;25:330–336.
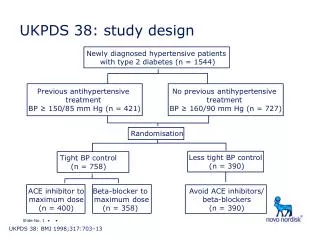
UKPDS intensive blood pressure control study: Goals • To determine if tight blood pressure control policy can reduce morbidity and mortality in patients with Type 2 diabetes • To determine if an ACE inhibitor (captopril) or beta-blocker (atenolol) is advantageous in reducing the risk of development of clinical complications UKPDS Group. BMJ. 1998;317:703–713.
UKPDS intensive blood pressure control study: Management regimens • 1148 hypertensive patients randomised • Tight blood pressure control with ACE inhibitor (n=400) or beta-blocker (n=358) • treatment goal: <150/85 mm Hg • Less tight blood pressure control without ACE inhibitor or beta-blocker (n=390) • treatment goal: <180/105 mm Hg UKPDS Group. BMJ. 1998;317:703–713.
UKPDS intensive blood pressure control study: Results Less tight control† 160/94 154/87 Tight control† 161/94 144/82 Average difference — 10/5 Start (mm Hg) Finish (mm Hg) † Non-compliance of antihyperytensive agents was 43%of total person years in less tight control group and 6% of total person years in tight control group UKPDS Group. BMJ. 1998;317:703–713.
UKPDS: Risk reduction in the intensive blood pressure control study Any diabetes-related endpoint 24 Diabetes-related deaths 32 Myocardial infarction 21 Heart failure 56 Stroke 44 Microvascular disease 37 Risk reduction* (%) * Tight vs less tight control UKPDS Group. BMJ. 1998;317:703–713.
UKPDS: Relationship between endpoints and HbA1c or BP 80 Rate ± 95% CI Microvascular endpoints Myocardial infarction 60 HbA 1c Incidence (1000-pt-yr-1) 40 HbA 1c BP 20 BP 0 5.0 7.0 9.0 11.0 5.0 7.0 9.0 11.0 110 130 150 170 110 130 150 170 HbA (%) or systolic BP (mmHg) HbA (%) or systolic BP (mmHg) 1c 1c Stratton et al. BMJ. 2000;321:405–412.
UKPDS: Implications • The UKPDS results support the mandate that intensive glycaemic control is required to reduce the risk of microvascular complications in people with Type 2 diabetes • Macrovascular disease prevention requires management of cardiovascular risk factors in addition to hyperglycaemia • No increase in cardiovascular events or death was observed and the risk of atherosclerotic events should not discourage intensive management • The benefits of intensive glycaemic control outweigh the risk of hypoglycaemia • Tight blood pressure control reduces diabetes-related mortality, heart failure and stroke • The phrase ‘intensive’ in this study is somewhat misleading as it corresponds to usual clinical management in many centres