Download
1 / 13
130 likes | 197 Views
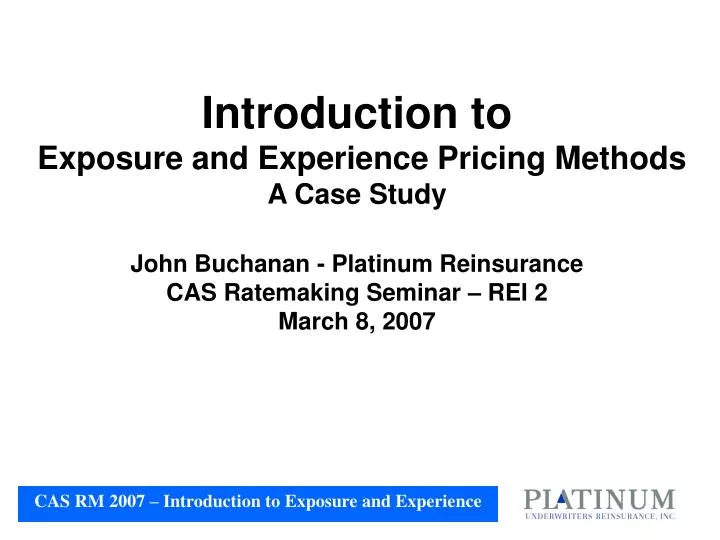
Introduction to Exposure and Experience Pricing Methods A Case Study John Buchanan - Platinum Reinsurance CAS Ratemaking Seminar – REI 2 March 8, 2007. CAS RM 2007 – Introduction to Exposure and Experience. Agenda. Introduction to Case Study (5 mins – John) Reinsurance Proposal

E N D
Introduction to Exposure and Experience Pricing MethodsA Case StudyJohn Buchanan - Platinum ReinsuranceCAS Ratemaking Seminar – REI 2March 8, 2007 CAS RM 2007 – Introduction to Exposure and Experience
Agenda • Introduction to Case Study (5 mins – John) • Reinsurance Proposal • Pricing Information Received • Exposure Rating (30 mins – Kathy) • Basics of Method • Indications • Experience Rating (30 mins – Tice) • Basics of Method • Indications • Comparison of Results and Wrap-up (10 mins – John) • Virtual Underwriting • Next Steps • Questions
Reinsurance Proposal • Layer $100,000 xs $100,000 • Estimated Premium: $40,000,000 • Rapid growth recently • Was $10,000,000 six years ago • Large apparent rate increases • GL Business • Southeast US • Underwriting • Business has been sold a few times during 12 year history to different fronting carriers • Latest sold two years ago
Pricing Information Received • Premiums • by Class Code • by Policy Limit • Historical loss ratios • Claim listings • Reporting threshold of $50,000 • Current evaluation • Histories • Claims • Reserve stair-stepping • Higher than average expenses
Exposure and Experience Pricing • Presentations…
What’s your final answer? • Experience for this layer is half of the exposure • Exposure = 3.92% (1.57 mm) • Experience = 1.85% (0.74 mm) • Trick Question…
Exposure Pricing • Don’t look just at layer you are pricing (100 xs 100k) • Look at layers below and above as well • Look at Exposure burns and claim counts
Experience Pricing • Ditto for Experience Pricing • Use same layers for easier comparison
Exposure and Experience Comparison • In this case study, there is an inconsistent relationship as move up the attachment points • While the low layer experience is about half of exposure, the upper layers are about equal to exposure • Need more investigation to reconcile and help solve the puzzle(next session – REI3)
Appendix • Credibility • One of the most difficult puzzle pieces
Assessing Credibility of Exposure Method • Assess confidence in: • Exposure curve selected • Exposure profile • Source of hazard or sub-line information • Prediction of next years primary loss ratio • Percentage of non-modeled exposure, clash, etc. • Company strategy and ability to realize strategy • Possibly take questionnaire / scoring approach to mechanize (Patrik/Mashitz)
Assessing Credibility of Experience Method • Assess confidence due to: • Overall volume of claims • Volume of claims within layer (lucky or unlucky?) • Stability of year by year experience results • “ layer to layer experience results • Source of loss development, trend factors, historical rate changes and deviations • Changes in historical profile limits • Appropriateness of any claims or divisions that may have been removed (or “as-if’d”) • Experience score compared to exposure score to determine credibility weight
Increase Credibilityby Reducing Variability • Above figure from iconic Philbrick CAS paper • In this case, A represents Experience rating average (with indicated process noise), while B represents Exposure • Goal will be to bring A and B closer together thereby reducing parameter variance, with any remaining difference being process noise