Download
1 / 13
130 likes | 286 Views
Experiments with Plants. Mr. Huttle’s Class Orange group Trevor, Arpan, Clara, Lika. +. Wisconsin Fast Plants. Conclusion. Graph of Plant Growth: Control. Graph of Plant Growth: Test. Variable we tested (Manipulated). Sketch of flowering Plant. Sketch of fertilized Plant. Variables

E N D
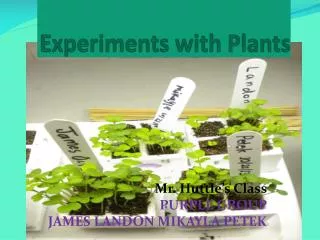
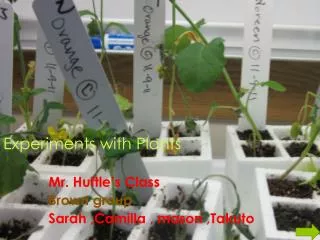
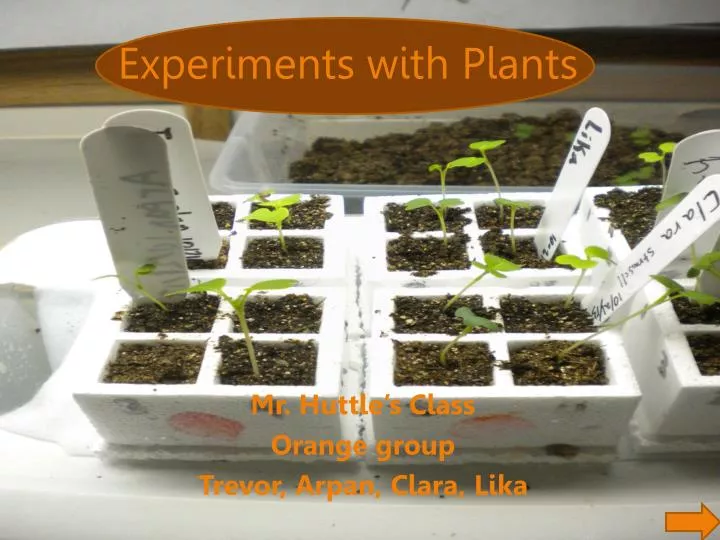
Experiments with Plants Mr. Huttle’s Class Orange group Trevor, Arpan, Clara, Lika
+ Wisconsin Fast Plants Conclusion Graph of Plant Growth: Control Graph of Plant Growth: Test Variable we tested (Manipulated) Sketch of flowering Plant Sketch of fertilized Plant Variables Not Changed (Controlled) Illustration of interdependence between flowering plants and bees Sketch of worker bee How we tested the variable (Responding)
History of the Wisconsin Fast Plant I wonder if this works? Dr. Paul Williams a researcher and sicencetest at university of Wisconsin created the WFP because he wanted to invent a plant that grows fast, that is small and compact and grows well under consent light ,reproduces lots of seeds and pollen, and their seeds do not need dormancy period. After many years of experimenting with many different plants he finally created a plant that does everything he wanted and he called it the Wisconsin Fast Plant.
Variable we tested (Manipulated) The variable we tested was fertilizer. We tested this because we did not know what would happen if the plant got ten fertilizer pellet instead of one. Our prediction was that the plant would grow taller or wider. When the plant grew we realized that our prediction was wrong, because Trevor’s plant were smaller then other groups and even some of Arpan’s haven’t even sprouted. How we tested it was we put 10 fertilizer pellets in one planter cell instead of three. orange groups planter cells
Variables Not Changed (Controlled) The variables we did not change were water, space, light, and temperature. We did not change these variables by giving the plants plenty of light, keeping the room at the required temperature, not planting more than one seed in one planter cell, and giving the plant enough water. We did not change these variables because the plant cannot grow without certain amount of water, space, light, and temperature. Water Space Light Temperature
How we tested the variable (Responding) When our group was discussing what thing we were going to experiment with we all thought we should do space. But then someone realized it would take super long to do our observations. None of us wanted to do light so we did fertilizer. We did fertilizer because we wanted to experiment through the whole process. How we tested the variable was when we were putting together the planter cells we put in ten fertilizer pellets instead of one. We realized that the pellets did not go well with the plants. We know this because our groups plants were not growing as well as the other groups plants. So the only way we tested the variable was we put ten fertilizer pellets in each planter cell instead of one.
Graph of Plant Growth: Control Plants In this graph the numbers in the column represent the amount of centimeters the plant grew, and the row on the bottom represents the days. As you can probably see the blue is Clara , the green is Arpan, The red is Lika, and the pink is Trevor. The average of how tall all the plants grew is about 12 inches.
Graph of Plant Growth: Test Plants These are all growth of tested plants. Planter cell 4. The green color is Arpan’s plant growth. The red color is Lika’s plant growth. The blue color is Clara's plant growth. The pink color is Trevor's plant growth. The most growth of the tested plant is Arpan’s. The least growth of plants was Lika’s experimental plant.
Sketch of flowering Plant The flowering plant has the petal, the anther, the filament, the stigma, the stamen, and the pollen grains. All the parts help the plant reproduce. The plant reproduces by cross pollination, that is when a worker bee goes to a male plant and collects pollen. Then goes to a female plant and collects pollen. Then the pollen from the male plant goes on the female plant so the plant can reproduce.
Sketch of fertilized Plant a fertilized plant is a plant that has been fertilized or pollinated by a bee. Pollination means a bee coming to a flower and collecting pollen.
Sketch of worker bee The worker bee has a very important jobs in the bee hive. Here are some of the jobs that the bees have: Collect food Make food Protect the hive Make the hive Care for queen bee Pollinate the flowers The bees really depend on the worker bees because the worker bees do all of the work. The drones/ Males do not do any work except mate with the queen and pamper her.
Illustration of interdependence between flowering plants and bees The interdependence of the flower and the worker bee is the worker bee helps the flower reproduces by cross pollination. That is when the bee goes to a male flower and collects pollen, then goes to a female flower and collects pollen. When this happens the flower can reproduce. The flower helps the bee by giving it pollen to make honey. The honey is food for the bee, so without it the bee could not survive. That is the interdependence between the flower and worker bee.
Conclusion The tested variable (fertilizer) affected the experimental plants by either making them grow taller and smaller. We know this because some of our groups plants did not grow as tall, and some people in our group’s plants grew much taller than other people’s. We realized that the controlled plants grew much better than the experimental plants. We know this because some of the experimental plants died before the end of the unit, and all of our controlled plants at least made it to the end of the six weeks that they lived. So the controlled plants worked much better than the experimental plants. Our group learned that the Wisconsin fast plant needs all of its variables to survive, water, fertilizer, light, and oxygen. Since the variable we tested (fertilizer) was a variable that the Wisconsin fast plant needed the experimental plant did not grow as well as the controlled plants.