Download

1 / 25
280 likes | 884 Views
Bayes’ Theorem. Example. Three jars contain colored balls as described in the table below. One jar is chosen at random and a ball is selected. If the ball is red, what is the probability that it came from the 2 nd jar?. Example. We will define the following events:

E N D
Example • Three jars contain colored balls as described in the table below. • One jar is chosen at random and a ball is selected. If the ball is red, what is the probability that it came from the 2nd jar?
Example • We will define the following events: • J1is the event that first jar is chosen • J2is the event that second jar is chosen • J3is the event that third jar is chosen • R is the event that a red ball is selected
Example • The events J1 , J2 , and J3 mutually exclusive • Why? • You can’t chose two different jars at the same time • Because of this, our sample space has been divided or partitioned along these three events
Venn Diagram • Let’s look at the Venn Diagram
Venn Diagram • All of the red balls are in the first, second, and third jar so their set overlaps all three sets of our partition
Finding Probabilities • What are the probabilities for each of the events in our sample space? • How do we find them?
Computing Probabilities • Similar calculations show:
Venn Diagram • Updating our Venn Diagram with these probabilities:
Where are we going with this? • Our original problem was: • One jar is chosen at random and a ball is selected. If the ball is red, what is the probability that it came from the 2nd jar? • In terms of the events we’ve defined we want:
Finding our Probability • We already know what the numerator portion is from our Venn Diagram • What is the denominator portion?
Arithmetic! • Plugging in the appropriate values:
Another Example—Tree Diagrams All tractors made by a company are produced on one of three assembly lines, named Red, White, and Blue. The chances that a tractor will not start when it rolls off of a line are 6%, 11%, and 8% for lines Red, White, and Blue, respectively. 48% of the company’s tractors are made on the Red line and 31% are made on the Blue line. What fraction of the company’s tractors do not start when they roll off of an assembly line?
Define Events • Let R be the event that the tractor was made by the red company • Let W be the event that the tractor was made by the white company • Let B be the event that the tractor was made by the blue company • Let D be the event that the tractor won’t start
Extracting the Information • In terms of probabilities for the events we’ve defined, this what we know:
What are we trying to find? • Our problem asked for us to find: • The fraction of the company’s tractors that do not start when rolled off the assembly line? • In other words:
Tree Diagram • Because there are three companies producing tractors we will divide or partition our sample space along those events only this time we’ll be using a tree diagram
Follow the Branch? • There are three ways for a tractor to be defective: • It was made by the Red Company • It was made by the White Company • It was made by the Blue Company • To find all the defective ones, we need to know how many were: • Defective and made by the Red Company? • Defective and made by the White Company? • Defective and made by the Blue Company?
The Path Less Traveled? • In terms of probabilities, we want:
Computing Probabilities • To find each of these probabilities we simply need to multiply the probabilities along each branch • Doing this we find
Putting It All Together • Because each of these events represents an instance where a tractor is defective to find the total probability that a tractor is defective, we simply add up all our probabilities:
Bonus Question: • What is the probability that a tractor came from the red company given that it was defective?
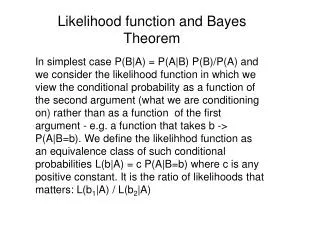
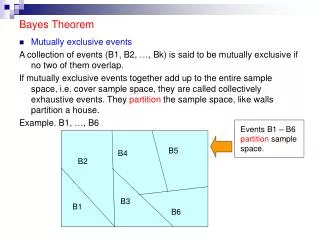
I thought this was called Bayes’ Theorem? • Bayes’ Theorem • Suppose that B1, B2, B3,. . . , Bn partition the outcomes of an experiment and that A is another event. For any number, k, with 1 k n, we have the formula:
In English Please? • What does Bayes’ Formula helps to find? • Helps us to find: • By having already known: