Download
1 / 37
370 likes | 524 Views
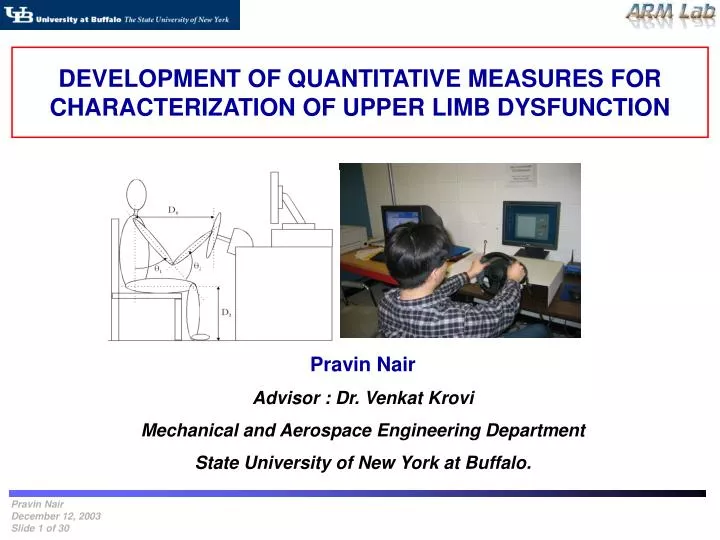
DEVELOPMENT OF QUANTITATIVE MEASURES FOR CHARACTERIZATION OF UPPER LIMB DYSFUNCTION. Pravin Nair Advisor : Dr. Venkat Krovi Mechanical and Aerospace Engineering Department State University of New York at Buffalo. Presentation Overview. Motivation - Stroke, Rehabilitation and Diagnosis

E N D
DEVELOPMENT OF QUANTITATIVE MEASURES FOR CHARACTERIZATION OF UPPER LIMB DYSFUNCTION Pravin Nair Advisor : Dr. Venkat Krovi Mechanical and Aerospace Engineering Department State University of New York at Buffalo.
Presentation Overview Motivation - Stroke, Rehabilitation and Diagnosis - Research Goals Background - Robotic Therapy Devices Implementation Framework - Hardware and Software Integration - Parameterized Exercise Protocols Experiments - Design of Experiments Results and Analysis -Mathematical Preliminaries - Quantitative Measures - Analysis of Obtained Data Conclusions and Future Work - Summary - Work in Progress
Stroke and Rehabilitation • when a blood clot blocks a blood vessel or artery, or when a blood vessel breaks, interrupting blood flow to an area of the brain, causing brain cells to die. • Each year, over 750,000 people experience a new or recurrent stroke, leading to motor disability and upper limb (UL) dysfunction [NSA]. • Rehabilitation A goal-oriented process, which enables individuals with impairments to reach their optimal physical, mental and/or social functional level. • Functional recovery linked to the duration, frequency, regularity and intensity of the rehabilitation therapy [1-5]. • Diagnosis A term which names the primary dysfunction towards which the therapist directs the Rehabilitation regimen STROKE Rehabilitation Diagnosis References [1-5] listed in slide 32 MotivationBackground Implementation Framework Experiments Results & Analysis Future Work
Rehabilitation Regimen Implementation Issues • Careful characterization of the functional impairment. • Variability within population • Variability due to disease progress • Subjective v/s Objective Assessment • Overall economic viability and logistics of deployment. • Accurate and Ongoing Assessment • Infrastructure Access/Costs • v/s • Functional Recovery • Exercise Regimen: • Free-Motion • Machine-Assisted • Logistics: • Inpatient • Outpatient • Home-based MotivationBackground Implementation Framework Experiments Results & Analysis Future Work
Virtual Driving Environment COTS + Virtual Environment + Path Devices Library Goal of the Research Work • A low-cost, home-baseddiagnostic and rehabilitation tool. • Implementation as an immersive Personal Movement Trainer: • Adequacy for quantitative assessment and ability to differentiate between users. • Target Audience: People with Upper Limb (UL) dysfunction due to Stroke MotivationBackground Implementation Framework Experiments Results & Analysis Future Work
Constraint-Induced Therapy Constraint Induced TherapyThe patient’s less impaired arm is restrained, and the patient intensively practices moving the more impaired arm, with feedback from a therapist. Constraint Induced Therapy Advantages: • Improves functional use • Expands cortical representation of the exercised limb. Disadvantages: • Needs continuous monitoring • Needs specialized equipment or crude methods for restraining the less impaired limb Motivation Background Implementation Framework Experiments Results & Analysis Future Work
Current Technology and their Shortcomings 1.Current functional assessment (diagnostic testing) is subjective or semi-quantitative 2. Existing Robotic Therapy Devices (low-cost, portable, force-feedback devices) are specialized and concentrate on rehabilitation (as opposed to diagnosis and rehabilitation). • MIT-MANUS • Rutgers Master II (RMII) • ARM Guide, JAVA Therapy • PHANTOM-based diagnosis Examples of existing Robotic Diagnosis and Rehabilitation devices Motivation Background Implementation Framework Experiments Results & Analysis Future Work
Existing Specialized Robotic Therapy Devices MIT-MANUS [1] Rutgers Master II (RMII) [2] ARM Guide [3] [1] M. Aisen, H. Krebs, N. Hogan, F. McDowell, and B. Volpe. “The effect of robot-assisted therapy and rehabilitative training on motor recovery following stroke,” Arch. Neurol., vol. 54, pp. 443–446, Apr.1997. [2] V. Popescu, G. Burdea, M. Bouzit, and V. Hentz. “A Virtual-Reality-Based Telerehabilitation System with Force Feedback,” IEEE trans. on Information Technology in Biomedicine, vol. 4, no.1, March 2000. [3] D. Reinkensmeyer, B. Schmit, and W. Rymer, “Assessment of active and passive restraint during guided reaching after chronic brain injury,” Ann. Biomed. Eng., vol. 27, pp. 805–814, 1999. Motivation Background Implementation Framework Experiments Results & Analysis Future Work
Existing COTS-device and a Specialized Diagnostic Tool “JAVA Therapy” COTS device [1] PHANTOM-based diagnostic tool [2] [1] D. Reinkensmeyer, C. Painter, S. Yang, E. Abbey, and B. Kaino, “An Internet-Based, Force-Feedback Rehabilitation System for Arm Movement after Brain Injury,” Proceedings of Technology and Persons with Disabilities Conference, 2000. [2] A. Bardorfer, M. Munih, A. Zupan, and A. Primožič. “Upper Limb Motion Analysis using Haptic Interface,” IEEE/ASME transactions on Mechatronics, Vol.6, No.3, September 2001. Motivation Background Implementation Framework Experiments Results & Analysis Future Work
IMPLEMENTATION FRAMEWORK EXERCISE-PROTOCOLS Interface Hardware Immersive Virtual Environment ParameterizedTherapies GAMING DEVICES Low-Cost Mass ProducedDevices Functional Assessment &Motor Rehabilitation DESKTOP/LAPTOP PC Our Hypothesis At Present: • Emphasizes: • COTS force-feedback devices • Immersive environment • Parameterized exercises 1. One such device developed 2. Diagnostic capabilities only Motivation Background Implementation Framework Experiments Results & Analysis Future Work
Immersive DrivingScenario User Input User Input Vehicle Vehicle Visualization from wheel & Kinematics pedals pedals Parameterized Exercise Routines Pathsparameterized by amplitude and frequency Overall Implementation Motivation Background Implementation Framework Experiments Results & Analysis Future Work
Virtual Vehicle Model The user is considered to be driving a differential-drive vehicle which can be modeled using the knife-edge model. • Motion of the origin of the body-fixed reference frame w.r.t. the inertial frame: • Vxin thebody-fixedx-direction • Vy in the body-fixed y-direction ( Vy = 0) • angular velocity ω Knife edge kinematic model of a differentially driven wheeled vehicle. Motivation Background Implementation Framework Experiments Results & Analysis Future Work
Simulink Implementation of the System Vehicle Kinematics Data Collection Data Output Simulink Block diagram of the system implemented Motivation Background Implementation Framework Experiments Results & Analysis Future Work
Visualization Aspect of the system Examples of 3D visual interfaces for our Virtual Driving Environment (a) with simple parametrically generated paths; (b) with realistic roads from a database. Example of a 2D GUI which allows conduct of the experiment and provides immediate relevant statistical feedback. Motivation Background Implementation Framework Experiments Results & Analysis Future Work
Testing Procedure Assumptions and Standards : • Subjects are “healthy” • Arm angles fixed at: • θ1 = 45° • θ2 = 60° • D1 and D2 adjusted to maintain a fixed offset Experimental Test Setup, Schematic with relevant parameters Motivation Background ImplementationFramework Experiments Results & Analysis Future Work
Testing Procedure (Cont:) TASK Guide the “vehicle” along parametrically generated paths, remaining as close as possible to the center line, with 3 preset forward speeds. Parametric library of labyrinthine maze-style paths and sinusoidal paths used for the diagnostic testing routine 2D GUI Patient/Therapist Interface Motivation Background ImplementationFramework Experiments Results & Analysis Future Work
Actual Path Desired Path Testing Procedure (Cont:) Plot of the user generated and actual paths x-coord. y-coord. 0.0025109 0.074788 0.003825 0.082172 0.005139 0.089556 0.0065688 0.096918 0.0079985 0.10428 0.0094857 0.11163 0.01103 0.11897 0.012632 0.1263 0.014263 0.13362 Sample collected data Movie file depicting the testing routine Motivation Background ImplementationFramework Experiments Results & Analysis Future Work
Y R(t) Where, is the tangential angle X Planar Curve and Cubic Spline Planar Curve Arc Length Cubic Spline Curve Normal Curve Tangent Where, Curvature of a Curve Motivation Background ImplementationFramework Experiments Results & Analysis Future Work
Fourier Mathematics Original Periodic Signal Discrete Fourier Transform Spectral Energy Motivation Background ImplementationFramework Experiments Results & Analysis Future Work
Actual Path Desired Path Performance Measures A quantity which explicitly expresses some desirable characteristic of an individual which helps in categorization of the (motor) ability/skill of that individual. Error Value Parameter (EVP) Curvature-Based Performance Measure Discrete Fourier Transform-Based Error Measure Our Measures 1. Error Value Parameter (EVP) Difference between the desired and actual path at each time instant. Motivation Background ImplementationFramework Experiments Results & Analysis Future Work
Principal Harmonic Secondary Harmonics Performance Measures (cont:) 2. Curvature-Based Performance Measure Comparison between the desired and actual path curvatures at for the corresponding arc length. Where, 2. Discrete Fourier Transform-Based Error Measure Or, Motivation Background ImplementationFramework Experiments Results & Analysis Future Work
Result Analysis Graph showing time taken by the subjects to traverse the path ‘Sine1’ at all speeds. Plot showing the EVP plotted against the time value collected from the subjects for ‘Sine1’ at ‘Low’ speed. Motivation Background ImplementationFramework Experiments Results & Analysis Future Work
Results (cont:) Plot of curvatures of the user generated curve superimposed over the expected curvature. Motivation Background ImplementationFramework Experiments Results & Analysis Future Work
Results (cont:) Plot of Frequency spectrum of user generated curves at ‘Low’ speed on ‘Sine1’ path. Table of Energy Ratios Motivation Background ImplementationFramework Experiments Results & Analysis Future Work
Results (cont:) Plots of comparison of subject performance (Error Value Parameter) in two trials- Trial 1: Initial test and Trial 2: Test after 6 months. Motivation Background ImplementationFramework Experiments Results & Analysis Future Work
Results (cont:) Plots of comparison of subject performance (Curvature Comparison) in two trials- Trial 1: Initial test and Trial 2: Test after 6 months. Motivation Background ImplementationFramework Experiments Results & Analysis Future Work
Conclusions Successful development, implementation and testing of a low-cost diagnostic tool Preliminary tests display the potential of the set-up as a diagnostic tool Considerable promise for improving the speed, resolution and quality of diagnosis. Motivation Background ImplementationFramework Experiments Results & Analysis Future Work
Continuing/Future Work Test the tool with people with UL dysfunctions Provide force-feedback to the subjects Develop a 3-D interface as patient feedback to the therapist Add strength training/recovery aspects to the tool Network the tool through the internet Motivation Background ImplementationFramework Experiments Results & Analysis Future Work
References • M. Aisen, H. Krebs, N. Hogan, F. McDowell, and B. Volpe. “The effect of robot-assisted therapy and rehabilitative training on motor recovery following stroke,” Arch. Neurol., vol. 54, pp. 443–446, Apr.1997. • H. Krebs, N. Hogan, M. Aisen, and B. Volpe. “Robot-Aided Neurorehabilitation,” IEEE transactions on Rehabilitation Engineering, vol. 6, no. 1, March 1998. • B. Volpe, H. Krebs, N. Hogan, L. Edelsteinn, C. Diels, and M. Aisen. “Robot training enhanced motor outcome in patients with stroke maintained over 3 years,” Neurology, vol. 53, pp. 1874–1876, 1999. • K. Kwakkel et al. “Effects of intensity of rehabilitation after stroke, a research synthesis,” Stroke, vol. 28, no. 8, pp. 1550–1556, 1997. • P. Langhorne, R. Wagenaar, and C. Partridge. “Physiotherapy after stroke: More is better?,” Physiotherapy Res. Int., vol. 1, pp. 75–88, 1996.
Curvature Comparison Example Example Motivation Background Performance Measures Implementation Framework Experiments & Results Future Work
Discrete/Fast Fourier Transform Analysis Frequency Spectrum of a signal Principal Harmonic Secondary Harmonics Where, Useful Energy is the energy captured by the more significant peaks of the Fast Fourier Graph. Motivation Background Performance Measures Implementation Framework Experiments & Results Future Work
Continuing Work Motivation Background Performance Measures Implementation Framework Experiments & Results Future Work
Internet User Interface Therapist’s Interface Graphical Display Internet Device Manager Virtual Environment Therapist Subject Functional Interaction Functional interaction of the visualization, programming and data acquisition components.
Mean Deviation Result Table Mean deviation values for the subjects at all the 3 speeds for the 3 sinusoidal paths. Motivation Background Performance Measures Implementation Framework Experiments & Results Future Work