Download
1 / 38
390 likes | 550 Views
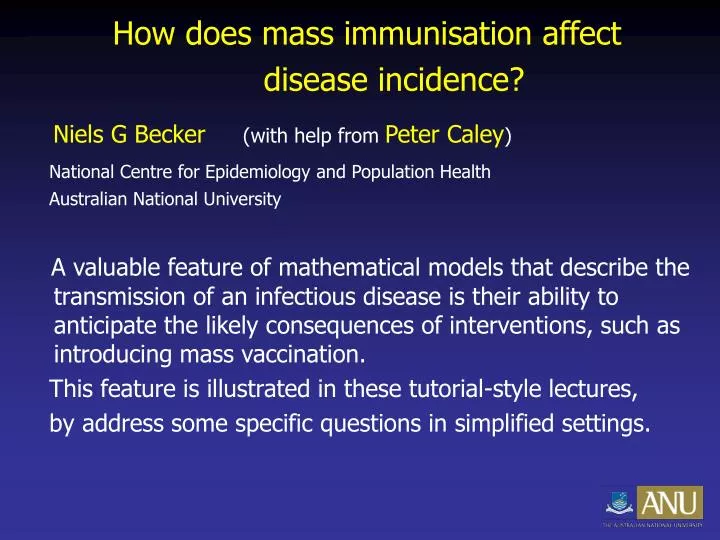
How does mass immunisation affect disease incidence?. Niels G Becker (with help from Peter Caley ) National Centre for Epidemiology and Population Health Australian National University

E N D
How does mass immunisation affect disease incidence? Niels G Becker (with help from Peter Caley) National Centre for Epidemiology and Population Health Australian National University A valuable feature of mathematical models that describe the transmission of an infectious disease is their ability to anticipate the likely consequences of interventions, such as introducing mass vaccination. This feature is illustrated in these tutorial-style lectures, by address some specific questions in simplified settings.
Specific Questions • How well does immunisation control epidemics? • How well does immunisation control endemic transmission? • Is it always a good thing to promote vaccination? • What is a good strategy to protect a vulnerable group?
Question 1How well does immunisation control epidemics? More specifically: Suppose the infection is absent and everyone is susceptible. (a) What happens when the infection is imported? (b) How is this changed when part of the community has been immunised prior to the importation?
The setting Assume that the community size (n) is constant over the duration of the epidemic, and thatn is large. Suppose the infection is transmitted primarily by person-to-person contacts. For example, measles or a respiratory disease. Suppose that all n members of community are initially susceptible to this infection. At time t = 0, one recently infected individual arrives. 1. What happens? 2. How is ‘what happens’ altered if a fraction of community members is totally immune?
Assume individuals are homogeneous and mix uniformly infection Susceptible St Infectious It Removed (immune) The deterministic SIR epidemic model for this process is Rate of change in susceptibles = Rate of change in infectives = The solution (found numerically) depends on the initial values I0 and S0, and on the values of the parameters , the transmission rate, and , the recovery rate.
Setting 1 SupposeI0 = 1 n =S0 = 1000 = 0.3 = 0.1 What happens ? The model predicts that the outbreak takes off and the epidemic is described by Total number infected =area under curve / 10 ≈ 941 Question: Could something else happen?
Setting 2 Suppose I0 = 1 n =S0 = 1000 = 0.3/4 = 0.1 What happens ? The model predicts that the outbreak peters out and is described by Total number infected = area under curve / 10 ≈ 4 Question: What really happens?
We have seen these two types of outcomes: • This poses the questions: • What determines whether an outbreak takes off? • How large will the outbreak be?
(a) What determines whether an outcome takes off? It increases initiallywhen Italways decreaseswhen It increases initiallywhen Italways decreaseswhen Setting 1: (the outbreak takes off) Setting 1: (the outbreak takes off) Setting 2: (it does NOT take off) Setting 2: (it does NOT take off) determines whether the outbreak takes off. (actually, there’s an element of chance)
ASIDE: is the basic reproduction number. It is (rate at which the infective transmits) × (mean duration of the infectious period), R0 = mean number of individuals a person infects during their infectious period when everyone they meet is susceptible, and there is no intervention. The word basic is used when everyone else is susceptible and no intervention is in place. If R0 < 1 there can not be an epidemic. No intervention is required. If R0 > 1 an epidemic occurs. (Can occur)
If R0 > 1 an epidemic is prevented when R0S0 /n <1. • That is, when the susceptible fraction has been reduced to less • than 1/R0 , by immunisation. • How large will the outbreak be ? • Let • s0 = S0 /n = fraction initially susceptible • C∞ = eventual number of cases • c∞= C∞ /S0 = fraction of initial susceptibles eventually infected • Then
What happens if some community members are immunised? The initial reproduction number is Illustrate this for Setting 1I0 = 1, n = 1000, = 0.3, = 0.1 Proportion of infections among susceptible individuals - ln ( 1 - c ) s » ¥ 0 R c 0 ¥ Question: What really happens?
Question 2How well does immunisation control endemic transmission? More specifically: Suppose transmission is endemic in the community. (a) What does this mean? (b) How is endemic transmission changed when the community is partially immunised? (c) What happens to endemic transmission in response to a pulse of mass vaccination?
immunisation Birth infection Susceptible St Infectious It Recovered (immune) Death Death Death An infection is endemic in the community when transmission persists. It requires replenishment of susceptibles. This happens by births, so we add births and deaths.
Assume no immunisation The solution depends substantially on I0 and S0, but eventually settles down to steady state endemic transmission. We determine this state by solving the equations This gives
Numerical illustration • n = 1,000,000 R0= 15(e.g. measles) = 1/(70*365) (life expectancy of 70 years) = 1/7 (mean infectious period of 1 week) sE = 1/15, that is 1,000,000/15 = 66,667 susceptibles iE ≈ [7/(70*365)]*(1 1/15), that is 256 infectives In practice the numbers fluctuate around those values, because of chance fluctuations and seasonal waves driven by seasonal changes in the transmission rate. Question: Would imported infections change this?
What if we immunise a fraction of the newly born infants? Eventually Transmission can not be sustained when (1 – v)R0≤ 1 The infection is eliminated when the immunity coverage exceeds 1 – 1/R0. [Or s ≤ 1/R0.] Question: Why is sEnot affected by the immunisation, (as long as v≤1 – 1/R0)? Question: What happens wheniEis small?
Response to enhanced vaccination Suppose we have endemic transmission (without immunisation) and have a mass vaccination day. That is, we immunise a fraction v of susceptibles at t= 0. • So transmission declines immediately. • How much? And what happens then? • Consider the earlier example: • n= 1,000,000 R0= 15 • = 1/(70*365) = 1/7
Here’s what happens if we immunise 1%, namely 667, of the susceptibles: Question: What really happens?
Here’s what happens if we immunise 5%, namely 3333, of the susceptibles: Question: What really happens?
Two of our Specific Questions remain, namely • Is it always a good thing to promote vaccination? • What is a good strategy to protect a vulnerable group? We will look at these questions with regard to one simple model, which we now introduce. We choose a situation with two types of individual. One type is more vulnerable to illness, while the other type contributes more to the transmission. Practical examples include (a) rubella, and (b) influenza.
and N0are estimatedfrom demographic data First the demography Partition age into ‘young’ and ‘old’. People are ‘young’ when they are aged less than c years. The mortality rate is negligible for the ‘young’, and for the‘old’. The total community size is specified by
Suppose c = 50*365 = 18250 days and =1 / (10*365). Then the life expectancy is 50+10 = 60 years. The age distribution is Age With N0 = 100 the community size is 6000.
Next the transmission model Consider an SIR model in which the transmission rate is age-dependent We consider only the steady state of transmission. The steady state force of infection acting on the ‘young’ is , and that acting on the ‘old’ is ’. Estimate and ’ from age-specific surveillance data (perhaps using incidence data for a period before immunisation). , the recovery rate, is estimated from disease-specific data Suppose that = 0.0001, ’ = 0.00002, = 0.1
The steady state transmission equations are For a in [0, c) For a in [c, ∞) The solution can be found analytically or numerically.
The solution is as follows: For a in [0, c) For a in [c, ∞)
Proportion infectious at different ages – no vaccination 0.001 0.0008 0.0006 Proportion infected 0.0004 0.0002 0.0000 0 10 20 30 40 50 60 70 80 Age (years)
Proportion susceptible at different ages – no vaccination 1.0 0.8 0.6 Proportion susceptible 0.4 0.2 0.0 0 10 20 30 40 50 60 70 80 Age (years)
and ’, the forces of infection, change when we change the vaccination coverage. In contrast, the rates of making close contacts do not change, so it is useful to determine the corresponding transmission rates. The forces of infection and transmission rates are related by Can not determine 4 parameters from 2 equations
Assume proportionate mixing; i.e. the WAIFW matrix is We find and
Question 3Is it always a good thing to promote vaccination? More specifically: Consider a disease with more serious consequences for older people, but young people transmit more infection. Practical examples include (a) rubella, and (b) influenza. Any type of immunisation reduces the overall incidence, but some strategies may actually increase the incidence among older people, and so increase their risk.
Our parameter values are c = 50*365 days, =1 / (10*365), = 0.1, = 0.51, ’ = 0.10 Now suppose that a fraction v of individuals are vaccinated, essentially at birth. Then S0 is reduced from N0 to (1-v)N0. We first need to find the new expressions for Sa and Ia from the steady state transmission equations. Then substitute these in and solve for the new and ’.
Graph of cases aged over 50 at v relative to v = 0. 1.5 Vaccination at birth 1.0 Ratio of cases for age>C 0.5 0.0 0.0 0.2 0.4 0.6 0.8 1.0 Vaccination coverage
Question 4What is a good strategy to protect a vulnerable group? More specifically: As above, consider a disease which is more serious for older people and young people transmit more infection. To protect the old people, is it better (i) to vaccinate the young, or (ii) to vaccinate the older people? Practical examples again include (a) rubella, and (b) influenza.
Our parameter values are again c = 50*365 days, =1 / (10*365), = 0.1, = 0.51, ’ = 0.10 The above strategy vaccinated a fraction v of individuals at birth. For comparison, consider a strategy which, instead, vaccinates a fraction v of individuals as they reach the age of c years. Then Sc+ is reduced from Sc to (1-v) Sc. With this change we find the new expressions for Sa and Ia from the steady state transmission equations and substitute these in to solve for the new and ’.
1.5 Vaccination at birth Vaccination at C=50 years 1.0 Ratio of cases for age>C 0.5 0.0 0.0 0.2 0.4 0.6 0.8 1.0 Vaccination coverage Graph of cases aged over 50 at v relative to v = 0.
Limitations of these deterministic SIR model • It and St are taken as continuous when they are really integers. (Of concern when It or St are small) • They suggest that an outbreak always takes off when • R0 s0> 1. (Not always the case.) • They ignore the chance element in transmission. • (Of particular concern when It or St are small, e.g. during early stages) The End