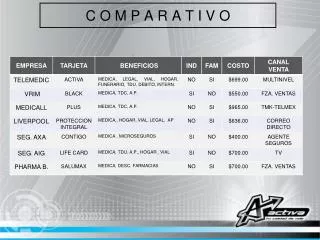
Download
1 / 16
160 likes | 272 Views
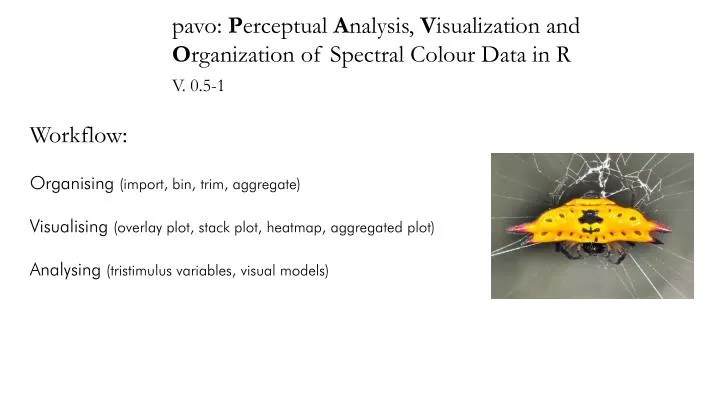
pavo : P erceptual A nalysis, V isualization and O rganization of Spectral Colour Data in R. V. 0.5-1. Workflow: Organising (import, bin, trim, aggregate) Visualising (overlay plot, stack plot, heatmap , aggregated plot) Analysing ( tristimulus variables, visual models).

E N D
pavo: Perceptual Analysis, Visualization and Organization of Spectral Colour Data in R V. 0.5-1 Workflow: Organising (import, bin, trim, aggregate) Visualising (overlay plot, stack plot, heatmap, aggregated plot) Analysing (tristimulus variables, visual models)
Example data set Euremaheacbe Lomandra sp. 30 ♀ 30 ♂ 50 leaves
Organising Functions: getspec – importing spectra (e.g. ‘.ttt’) as.rspec – convert object to ‘rspec’, interpolate, trim aggspec – aggregate spectra by a function plotsmooth – visually explore levels of LOESS smoothing procspec– smoothing, normalising, trimming, binning, remove neg. values
Visualising Function plot ‘overlay’ – all spectra in one plot ‘stack’ – individual stacked plots for comparison ‘heatmap’ – heatmap (best for 3d data) Function aggplot plot aggregated spectra – default mean ± s.d (can be customised)
Analysing Trichromatic variables (hue, saturation, brightness) Function summary Returns 28 (!) variables: know what you want Hue (x 5) Saturation (x 15) Brightness (x 3)
Visual Modelling • Some popular approaches: • Segment analysis (Endler 1990) – NB. Not really ‘visual’ • Receptor-noise (Vorobyev & Osorio 1998) • Colour hexagon (Chittka 1992) (coming) • Tetrahedral colour-space (Endler & Mielke 2005, Goldsmith 1990, Stoddard & Prum 2008) • -Be aware of assumptions, limitations etc. & justify all choices. • -Consider using multiple approaches & exploring effects of parameter variation (e.g. ‘noise’ where noise is uncertain) • -Test your results where possible!
e.g Segment analysis (Endler 1990) Function segclass
Predator Eg. Receptor-noise (Vorobyev & Osorio 1998) Q: Can this be seen against this by them Friend ♂ Another predator? ♀
Eg. Receptor-noise (Vorobyev & Osorio 1998) Quantum catch x x Stimulus Receptor sens. Illuminant Function:vismodel
Eg. Receptor-noise (Vorobyev & Osorio 1998) Receptor adaptation von-Kries correction - Function:vismodel
Eg. Receptor-noise (Vorobyev & Osorio 1998) Noise signal/noise ratio of receptor relative density of receptor Function:coldist
Eg. Receptor-noise (Vorobyev & Osorio 1998) Calculating chromatic contrasts: Eucilidean distance between points (Qi’s) weighted by noise (weber fraction) Units = Just Noticeable Distances (JND’s) Dichromatic - Function:coldist
Eg. Receptor-noise (Vorobyev & Osorio 1998) Trichromat - Tetrachromat - Function:coldist
Eg. Receptor-noise (Vorobyev & Osorio 1998) Achromatic contrast receptor/s used in achromatic vision Function:coldist
Eg. Tetrahedral colour-space -Useful for all sorts of stuff, flexible (e.g. Endler & Mielke 2005 vs Stoddard & Prum 2008) -Cannot tell you about ‘discrimination’ as no measure of noise included -Chromatic only • Calculations: • Quantum catch as per receptor noise (inc. all specified assumptions) with RELATIVE cone stimulation values instead of absolute • Plot ‘em as co-ordinates • Descriptors of points (angles & euc. distance from achromatic origin) are your colour variables (hue, saturation)
Eg. Tetrahedral colour-space Functions: vismodel– RELATIVE quantum catch in visual system tcs – calculate tetrahedral coordinates using results of vismodel dist – eucilidean distance between points in tetrahedron Visualising: tcsplot – 3d interactive plot projplot – 2d projection plot tcsvol – calculate volume overlap between clouds of points