Download
1 / 2
70 likes | 288 Views
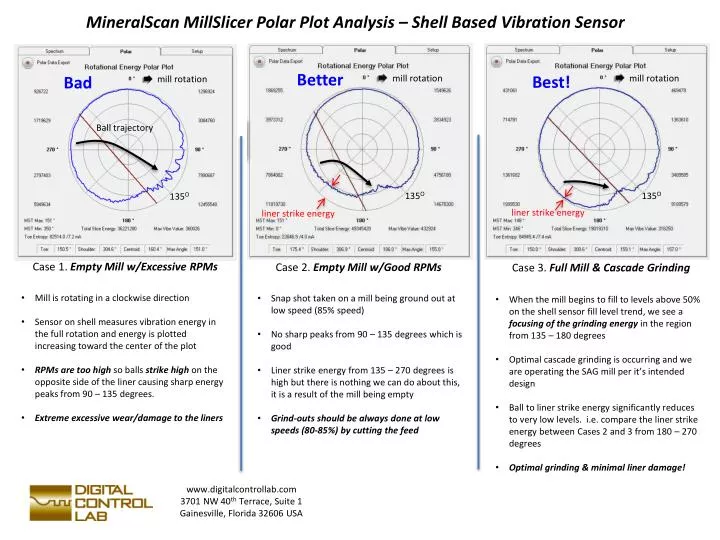
MineralScan MillSlicer Polar Plot Analysis – Shell Based Vibration Sensor. Better. Best!. Bad. m ill rotation. m ill rotation. m ill rotation. Ball trajectory. 135 O. 135 O. 135 O. l iner strike energy. l iner strike energy. Case 1. Empty Mill w/Excessive RPMs.

E N D
MineralScanMillSlicer Polar Plot Analysis – Shell Based Vibration Sensor Better Best! Bad mill rotation mill rotation mill rotation Ball trajectory 135O 135O 135O liner strike energy liner strike energy Case 1. Empty Mill w/Excessive RPMs Case 2. Empty Mill w/Good RPMs Case 3. Full Mill & Cascade Grinding • Mill is rotating in a clockwise direction • Sensor on shell measures vibration energy in the full rotation and energy is plotted increasing toward the center of the plot • RPMs are too high so balls strike high on the opposite side of the liner causing sharp energy peaks from 90 – 135 degrees. • Extreme excessive wear/damage to the liners • Snap shot taken on a mill being ground out at low speed (85% speed) • No sharp peaks from 90 – 135 degrees which is good • Liner strike energy from 135 – 270 degrees is high but there is nothing we can do about this, it is a result of the mill being empty • Grind-outs should be always done at low speeds (80-85%) by cutting the feed • When the mill begins to fill to levels above 50% on the shell sensor fill level trend, we see a focusing of the grinding energy in the region from 135 – 180 degrees • Optimal cascade grinding is occurring and we are operating the SAG mill per it’s intended design • Ball to liner strike energy significantly reduces to very low levels. i.e. compare the liner strike energy between Cases 2 and 3 from 180 – 270 degrees • Optimal grinding & minimal liner damage! www.digitalcontrollab.com 3701 NW 40th Terrace, Suite 1 Gainesville, Florida 32606 USA
MineralScanMillSlicerTrend Summary – Inlet, Outlet, Shell Vibration Sensors feed (dk. blue, ~390 TPH) feed (dk. blue, ~370 TPH) Note #1 shell fill lvl (yellow) Note #2 inlet fill lvl (green) motor pwr (white) toe entr (pink) outlet fill lvl (lt. blue) shell fill lvl (yellow) outlet fill lvl (lt. blue) motor pwr (white) inlet fill lvl (green) toe entr (pink) mill speed (red, slow, 85%) mill speed (red, slow, 85%) Case 2. Stable Operation w/Reduced Speed Case 1. Mill Start-up from Grind-out w/Reduced Speed • This trend was taken from the SAG upon start up where the feed was brought up first and then the speed was decreased to retain material. • When all three fill level signals track one another, the material entering the mill = the material leaving the mill. This is good stable operation! • Note #1: Toe Entropy (pink) is a measure of how hard the balls are striking the mill shell. 100% = Very bad liner damage, 0% = minimal liner damage. This signal should be kept under 50% if possible. • Like the trend on the left, the goal is to flatten all three fill level signals (inlet, shell, outlet). When all three sensor signals are flat, we can begin to further fill the mill by either increasing feed or reducing mill speed. This should then result in all three signals stepping up together in a uniform manner which is the desired method to slowly step fill the mill. The shell sensor polar plot should also be used to indicate a full mill. • Note #2: Due to temperature limitations, the SAG mill could not be run at its maximum intended feed rate (590+ TPH) and filled to high fill levels. However if there were no limitations and the mill were to overfill, we can immediately detect this by observing that the outlet signal (lt. blue) takes off upward in comparison to the other fill levels. The output signal should therefore be used to detect blockages. www.digitalcontrollab.com 3701 NW 40th Terrace, Suite 1 Gainesville, Florida 32606 USA