Download
1 / 42
420 likes | 572 Views
EDUCATOR EFFECTIVENESS IN WISCONSIN. Katharine Rainey Bradley Carl, PhD Director of Educator Effectiveness Researcher and Associate Director Department of Public Instruction Value-Added Research Center. How wi differs. National EE Context: Autonomy. National EE Context: Mastery.

E N D
EDUCATOR EFFECTIVENESS IN WISCONSIN Katharine Rainey Bradley Carl, PhD Director of Educator Effectiveness Researcher and Associate Director Department of Public Instruction Value-Added Research Center
National EE Context:Mastery Other States’ System Our System
“With a learning goal, [learners’ don’t have to feel that they’re already good at something in order to hang in and keep trying. After all, their goal is to learn, not to prove they’re [masters].” Traditional Evaluations • If you are good at something, it isn’t hard • You set goals to “demonstrate” your strengths and abilities • Struggles or challenges demonstrate weakness WIEE • The path to mastery is hard—otherwise, we would all do it/be there • Call it “teacher practice” because goal of practice is to improve performance—deliberate practice is only to improve performance
National EE Context:Purpose Other States’ Systems Linked to licensure and funding Our System To provide meaningful, informative data to each individual educator in their unique role/context to inform practice
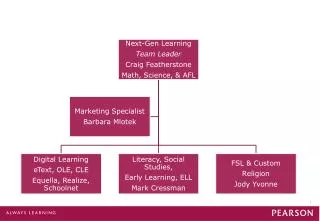
WISCONSIN:Informing Others • Other states • USDE • Other countries • Teachscape • Danielson Group
Teachscape • Timeline • Changes Expected vs. Received • Outages and Lost Data • Next Steps
Observations Changed for 14-15: Removed the long unannounced observation.
Student Outcomes The Student Outcomes Summary is comprised of scores from two to three different sources: Wisconsin Department of Public Instruction 2014-15Wisconsin Educator Effectiveness System-At-A-GlanceJune 2014
Changed for 14-15: removed “District Choice” as an outcome measure; assistant principals will not use Principal Value-Added data at this time.
Value Added Bradley Carl, PhD Researcher and Associate Director Value-Added Research Center (VARC) UW-Madison Research Center
What is Value-Added? A growth model which measures the contribution of schooling at various levels (school, grade, classroom, etc.) to gains in student performance over time Uses statistical techniques to separate the impact of schooling from other factors that may influence growth, but are generally beyond the control of schools/educators Goal: hold educators accountable for what they can and should control (improved achievement for all students), but not for what they can’t (the kinds of students they get)
A Visual Representation Actual student achievement scale score VA = (Actual – Predicted) Value-Added Starting student achievement scale score Predicted student achievement (Based on observationally similar students) November 2012 5th Grade WKCE November 2013 6th Grade WKCE
Value-Added in Wisconsin’s EE System School-level value-added (Reading only) Principal value-added Teacher value-added
Value-Added in Wisconsin’s EE System • School-level Reading (for most elementary and middle schools; 5% of Student Outcomes Summary): • Reflects wishes of EE Design Team to “message” shared responsibility for literacy instruction across the curriculum
Value-Added in Wisconsin’s EE System • Principal value-added (PVA) for most elementary and middle school principals: • Differs from schoolwide value-added by: • Building in an “adjustment period” for principals who are new to their building (since principal impact on student performance is less direct and because initial years mostly reflect the effects of prior principal) • Accounting for school starting point (to avoid creating disincentives to join lower-performing or higher-performing schools) • Incorporating PVA from previous assignments in WI, where available • See handout
Value-Added in Wisconsin’s EE System • Teacher-level value-added (for teachers responsible for Reading and Math): • Will be added to Student Outcomes Summary in the future when data systems fully support precise associations between students, teachers, and courses
Student Learning Objectives/School Learning Objectives (SLOs) Changed for 14-15: Reduced from two SLOs annually to one annually; evaluator no longer approves the EEP or SLO goals. (NOTE: The process should still be highly collaborative.)
Creating the SLO Score • SLO score is based on outcome results and process rather than results only • Educator owns the process to LEARN the process—focus directed at process and formative conversations more than score
An educator engaged in a multi-year Effectiveness Cycle will have multiple SLO processes that inform the final holistic score:
At the End of the Year • District staff ensure all component and SLO scores are in Teachscape • DPI “pulls” ONLY those scores from Teachscape to calculate final Summaries • Final summaries will be simple to calculate and transparent—not a surprise • Final summaries are the LEAST important part of the EE System process
Student Practice Summary Teachers: • Component scores averaged = Domain Summary • Domain Summary averaged = Practice Summary Principals: • Component scores averaged = Practice Summary
Changed for 14-15: removed “District Choice” as an outcome measure; assistant principals will not use Principal Value-Added data at this time.
Student Outcomes Summary • Individual measure scores weighted proportionally • Weighted scores added together • Summary rounded to nearest decimal on scale of 1-4 • Example:
Summary Graph The educator’s results will be reported visually using a coordinate pair on the Summary Graph, summarizing the data collected regarding their practice and outcomes across the Effectiveness Cycle. Wisconsin Department of Public Instruction 2014-15Wisconsin Educator Effectiveness System-At-A-GlanceJune 2014
Data Summaries • Remove use of word “Reporting” • Locally: • Provided in SAFE until WISEid becomes available option • Visually/graphically provide all data in most meaningful ways • Only between educator and their administrators • Federal: • USDE has approved this scoring process • USDE has provided initial approval for state-level reporting ONLY (for coming year)
For more information and resources related to the Wisconsin Educator Effectiveness System, please visit the WIEE website at: ee.dpi.wi.gov @WisDPI_EE @KatharineRainey dpiwis-ee.blogspot.com/ Wisconsin Department of Public Instruction 2014-15Wisconsin Educator Effectiveness System-At-A-GlanceJune 2014

![Wisconsin Educator Effectiveness in [DISTRICT NAME/ BUILDING NAME]](https://cdn3.slideserve.com/6661815/wisconsin-educator-effectiveness-in-district-name-building-name-dt.jpg)