Download
1 / 25
250 likes | 316 Views
Measuring the Growth of Work. Death to scaling. As input size N increases, how well does our automated system work? Depends on what you want to do! Use algorithmic complexity theory: Use measure big o: O(N) which means worst case Important for Search engines Databases Social networks

E N D
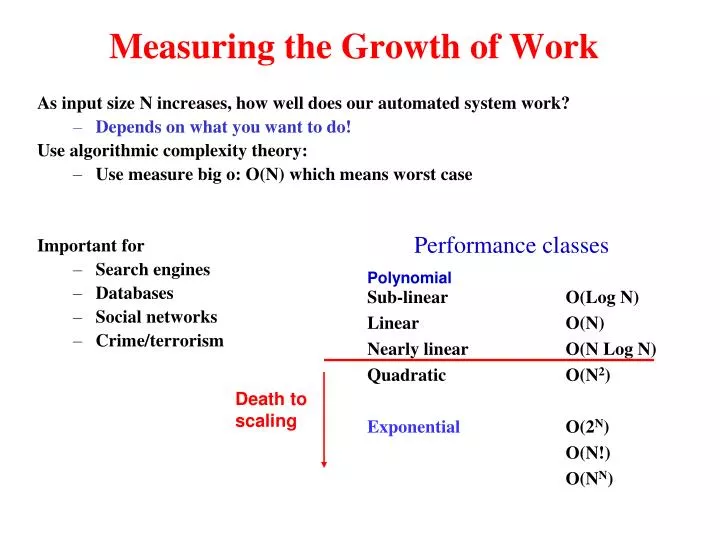
Measuring the Growth of Work Death to scaling • As input size N increases, how well does our automated system work? • Depends on what you want to do! • Use algorithmic complexity theory: • Use measure big o: O(N) which means worst case • Important for • Search engines • Databases • Social networks • Crime/terrorism Performance classes Polynomial Sub-linear O(Log N) Linear O(N) Nearly linear O(N Log N) Quadratic O(N2) Exponential O(2N) O(N!) O(NN)
How Much InformationReaches Americans Consumers? • Roger Bohn - Rbohn@ucsd.edu • HMI? Project -- Global Information Industry Center (GIIC) • UC San Diego • November 3, 2009
HMI? 2009 Scope • Consumers - Information used by Americans 1960 to 2008 • Enterprise - Information processed by servers worldwide in 2008 • Special studies, such as • Scientific data at MIT - giic.ucsd.edu • Health-care data • Enterprise storage growth
Defining “information” • Dozens of definitions (more than one per person!) • Information to consumers ≃ Data that is directly for people • Information supplied versus consumed • Whether they pay attention or not (multiple streams count fully) • Multiple metrics for measuring an information object • Bytes: emphasizes moving visual imagery InfoC • Words: ignores pictures InfoW
How many bytes in a 20 minute TV show? • Raw bytes = Screen size in pixels x bytes per pixel x frames per sec. • 1920 x 1080 x 3 x 30 = 186 Megabytes per second = 1.5 Gbps • TV compressed down to 1 to 2% e.g. 12 Mbps • Infocompressed counts “bytes through the cable” • Examples: SDTV ~ 4 Mbps = 2 GB per hour • Book = 12 bytes per word x 4 words per second = 400 bps
How do we consume information? Infow Infoc Source: HMI? 2009
Computer games ubiquitous • 35 M consoles sold in 2008; 10M Nintendo DS + 10 M Wiil • 70% of online adults play computer games • 7 of top 10 iPhone apps are games (by revenue)! • “Casual gaming” has removed gender bias
Sub-categories: computer games Full calculations go deeper: types of users, types of games, compression factors, others
Detail, fluid animation, lighting, good AI. This is from Xbox version - PC graphics better
Slices: How is info delivered? Airwaves includes TV broadcast, radio, mobile; Wires includes Cable TV, Internet; Physical = Print + Local computer
Other use Slices • “Interactive” information = telephone, computer games • now 55% of InfoC, 36% of InfoW • Traditional media = Cable TV, broadcast TV, radio, movies, print • Now now 36% of InfoC, 56% of InfoW • Define groupings of media types and information measures
What about Information Growth? • As costs fall, use increases. • Hypothesis: • ~ 35% per year growth in InfoC Incorrect!
slow Growth Source: HMI? 2009
Decomposing growth 1960-1980 • InfoC = (# Users) x (Average InfoH per user) x (Average bpsC)x 3600/8 • ∆InfoC = ∆Population + ∆(InfoH per capita) + ∆bpsC • Where ∆Y = (dY/dtime)/ Y = % rate of change of Y • 5.4% = 1.0% + 1.6% + 2.8% • = Population growth + Hours/person growth + InfoC intensity growth • Why did average bits per second only grow at 2.8% per year?
Why such slow growth? • TV penetration ~97% in 1980 • Hours per day: 7.4 in 1980 • 11.7 in 2008 • Intensity: 2.9 Mbps in 1980 • 6.5 Mbps in 2008 • TV in 1980: 4 Mbps SDTV • TV in 2008: 4 Mbps SDTV • 12 Mbps HDTV • < 1 Mbps Internet
what’s happened to print media? InfoW distribution across media 2008 • Print media = Magazines + books + newspapers • Print = fastest way to deliver words • Pool: 240 words per minute • 24% of Iwords in 1960; • 9% in 2008 • Web browsing another 28% Print 1980 1960 Television Computer e.g. Web browse Source: HMI? 2009 Telephone has grown in Sharew
Roll your own projections • What happens if cable TV increases bandwidth per channel? TV usage migrates to Hulu? • What if DVR users store 1% of what they watch, at high fidelity, for 2 weeks? • Quality versus quantity trends
Two Categories of Algorithms Lifetime of the universe 1010 years = 1017 sec Unreasonable 1035 1030 1025 1020 1015 trillion billion million 1000 100 10 NN 2N Runtime sec N5 Reasonable N Don’t Care! 2 4 8 16 32 64 128 256 512 1024 Size of Input (N)