Download
1 / 22
220 likes | 320 Views
The Diurnal Temperature Smart Tool. Angie Enyedi National Weather Service Jacksonville, FL. What is it and why the need for it? How is it implemented? What are the results?. What is it?.

E N D
The Diurnal Temperature Smart Tool Angie Enyedi National Weather Service Jacksonville, FL What is it and why the need for it? How is it implemented? What are the results?
What is it? An interpolation method of hourly temperatures between forecast maximum and minimum temperatures in the new graphical forecast produced by the NWS, the Interactive Forecast Preparation System (IFPS).
Initial Interpolation Techniques • The default interpolation methods in the Graphical Forecast Editor (GFE) were either the Cubic Spline or the Linear Interpolation Methods. • These methods were used during the implementation stage of IFPS.
Both fail to represent abrupt temperature falls after sunset and temperature rises after sunrise. • Both have unrepresentative peaks (linear) and plateaus (cubic spline) when the daily max or min temperature is achieved.
We need an interpolation tool that accounts for monthly differences in radiational cooling and insolation between the times of daily minimum and maximum temperatures! ANSWER: The Diurnal Temperature Tool
Cubic Linear Diurnal MAE ( F) 4.7 3.4 1.1 Mean Absolute Error
How the Tool was Implemented at JAX1. Stratifying the Data • 7 years of hourly ASOS observations were stratified by month then by hour for site JAX (Jacksonville, FL). • Archived data was obtained from NCDC. Date/Time (Z) Actual Temp Apr 1, 1995 0200Z 55 Apr 2, 1995 0200Z 53 ….etc… Apr 30, 2001 0200Z 66
2. Averaging the Data All temps in a particular hour in a given month were avearged to get an average Thour. All Temps for that hour summed, then divided by total number of entries to get Thour. Average Thour for 02Z in April = 59.56 For Example: Thour for 01 April = 60.30 Thour for 02 April = 59.46 Thour for 03 April = 58.59
3. Calculating the ratio, f Temperatures from 00Z-23Z were converted to a range between 5-95% based on the difference between the Tmax and Tmin each month. Note: f for Tmax = 95 f for Tmin = 5 This was done to reduce the warm and cold bias. (Thour-Tmin) Tmax-Tmin + 5 = f 90
4. Smart Tool references the “f” Table F Table for April 00Z 58 12Z 12 01Z 45 13Z 33 02Z 38 14Z 53 03Z 33 15Z 68 04Z 27 16Z 78 05Z 23 17Z 85 06Z 20 18Z 91 07Z 16 19Z 94 08Z 12 20Z 95 09Z 9 21Z 92 10Z 7 22Z 86 11Z 5 23Z 75 • The f table is referenced by the diurnal temperature smart tool when it calculates hourly temperatures (Thour) between the forecast daily minimum and maximum temperatures. • Tool will warm & cool temperatures based on monthly diurnal climatological trends.
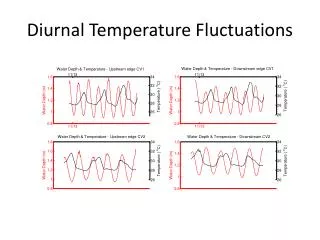
Note the seasonal variation of the approximate time of the daily max and min temperature. • Note the seasonal variation of temperature decrease (increase) after sunset (sunrise).
Cubic Linear Diurnal MAE ( F) 6.4 3.8 1.7 Mean Absolute Error
Cubic Linear Diurnal MAE ( F) 4.4 3.1 1.8 Mean Absolute Error
Cubic Linear Diurnal MAE ( F) 5.1 3.1 0.8 Mean Absolute Error
Results of the Diurnal Temperature Interpolation Method Data suggests that the diurnal temperature interpolation method better represents monthly radiational cooling & insolation trends when compared to the linear and cubic spline methods.
Benefits of the Diurnal Temperature Interpolation Tool • Best represents abrupt diurnal temperature rises and falls when compared to the cubic spline and linear interpolation techniques. • Has representative increases and decreases when the daily max or min temperature is achieved. • Can be customized for each month (and various sites across the country) accounting for differences in radiational warming & cooling.
Short Comings of the Diurnal Temperature Smart Tool • Only customized for site JAX in our forecast area. The tool is run over our entire grid space and may not represent radiational cooling or insolation trends at sites further inland nor those close to the coast. • Does not represent sensible heat influences from convection or latent heat influence from ground moisture. • Does not account for atypical warming/cooling such as warm air advection at night or cold air advection during the day.
Taking the Diurnal Smart Tool a Step Further… Data could be further stratified based on cloud cover, for example: Diurnal temperature smart tool could be created for sunny/mostly sunny, partly cloudy, and clouldy/mostly cloudy days in GFE.
Credits & Where to Get the Tool • Cheryl Sharpe and Steve Nelson (NWS) • Created the original Diurnal Temperature Smart Tool • Jason Hess • IFPS Focal Point NWS Jacksonville, FL • The Diurnal Temperature Smart Tool is available for download into IFPS at the Smart Tool Repository Website.
Thank You! Angie Enyedi Forecaster NWS Jacksonville, Climate F.P. angela.enyedi@noaa.gov Questions and/or Comments?