Download

1 / 54
540 likes | 773 Views
The Uses of Financial Analysis. The Uses of Financial Ratios. There are four principal reasons for extracting ratios from financial statements:. Performance assessment (Comparison with target) ; Trend analysis (Compare with past) ; Inter-firm comparison (Compare with competitors) ;

E N D
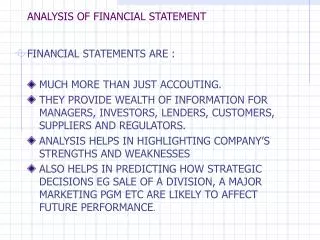
The Uses of Financial Ratios There are four principal reasons for extracting ratios from financial statements: • Performance assessment (Comparison with target); • Trend analysis (Compare with past); • Inter-firm comparison (Compare with competitors); • Test of reasonableness (Aid to forecasting).
The Uses of Financial Ratios Some ratios are applicable to every case whereas some others may be appropriate for only one. In the late seventies Value Added assessment was added to the existing methods to identify how wealth was created and distributed through industry. This concept can be useful, but it should be borne in mind that it is extremely easy to misinterpret the figures.
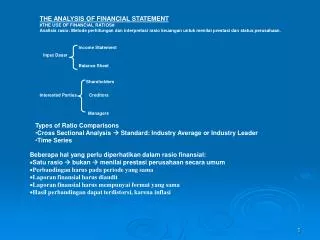
The Uses of Financial Ratios • Time series analysis. Comparison with figures from previous years. • Inter-company or cross sectional analysis. Comparison with the figures being achieved by specific competitors or the industry average. • Comparison with targets set by the firm or industry analysts.
The Focus of Financial Ratios • Profitability • Liquidity • Gearing • Activity/ Working Capital • Investment
Ratio Analysis • Individual ratios are meaningless when viewed in isolation, they must be used to build an overall picture of the financial performance.
Ratio Analysis • The method of calculation of ratios has to be consistent.
Ratio Analysis • Ratios are only as good as the information from which they are derived. If figures are unreliable or biased, so are the ratios. Beware of different accounting policies, e.g.. depreciation.
Ratio Analysis • Bear in mind that changing price levels will effect the position shown. Important in industries such as food retailing.
GKN 1995 • Group turnover £13.3bn • Market capitalisation £ 4.0bn • Share price £11.50
Current Ratio Measures short term solvency, i.e.. ability to pay debts Current Assets Current Liabilities
Issues • what are current assets/liabilities? • “rule of thumb” figure? • efficiency of assets/ • nature of business • cash generation (analyse cashflow statement/access to cash) • quality of assets • funding of capital expenditure
GKN 94-95 1995 1.48:1 1994 1.31:1
Quick Ratio Measures short-term solvency but excludes stock Current Assets - Stock Current Liabilities
GKN 94-95 1995 1.10:1 1994 0.99:1
Gearing Ratios Relates Borrowing to Equity Total Borrowings Equity
Issues • Who is financing the business? • Risks with Gearing • Structure of Borrowing • Serviceability • Window Dressing.
GKN 94-95 1995 40% 1994 54%
Interest Cover Profit Before Interest and Tax Interest Paid
GKN 94-95 1995 17x 1994 23x
Profitability It is not difficult for a company to make a profit. To make an adequate profit is harder, and to generate a more than satisfactory profit is fairly difficult (and fairly rare).
Profit Margin PBT Sales
GKN 94-95 1995 9.70% 1994 6.47%
ROCE Profitability measure. PBIT x 100 CE
Pyramid of Ratios PBT Sales GP Sales Operating Cost Sales Selling Costs Sales Admin Cost Sales Financing Costs Sales Labour Costs Sales Overhead Costs Sales Material Costs Sales
Asset Turnover Measures how effectively assets employed are being used to generate sales Sales Capital Employed
GKN 94 - 95 1995 3,304.7 = 2.36x 1,398.5 1994 3,089.6 = 2.41x 1,280.6 ROCE 9.37 x 2.36 = 22.12%
Fixed Asset Turnover Measures how effectively fixed assets are being employed to generate sales. Sales Tangible Fixed Assets
GKN 94 - 95 1995 3,304.7 = 3.73x 886.1 1994 3,089.6 = 3.27x 945
Stock Turnover Measures the number of times stock was turned over, i.e.. sold Cost of Sales (sales) Stocks
GKN 94 - 95 1995 1082.4 - 26.7 = 2.61x 405.2 1994 886.9 - 71.9 = 2.34 347.9
Average Trade Debtor Collection Period Average number of days credit given to customers Trade Debtors x 365 Sales
GKN 94 - 95 1995 348.4 x 365 = 38.5 days 3,304.7 1994 377.7 x 365 = 44.6 days 3,089.6
Average Trade Creditor Payment Period Average number of days credit taken from company suppliers Trade Creditors x 365 Cost of Sales
GKN 94 - 95 1995 338.2 = 116.9 days 1,055.7 1994 311.9 = 139.6 days 815
ROSEReturn on Shareholders’ Equity • capital growth • dividend income
Earnings per Share Profit after Tax Number of Shares
GKN 94 - 95including Exceptional Items 1995 187.4 = 53.9p 347.7 1994 92.3 = 28.3p 326.4
GKN 94 - 95excluding Exceptional Items 1995 199.2 = 57.3p 347.7 1994 122 = 37.4p 326.4
Price Earnings Ratio Widely quoted and reflects the ‘market’s’ view of the company and its prospects Market Share Price Earnings per Share
GKN 94 - 95 1995 11.50 = 20x 0.573
‘Prospective’ Multiple 11.50 = 17.6x 65.3
P/E Ratio Comparison Share Price Prospective P/E Prospective EPS 11.50 65.3 17.6 GKN Lucas Verity 2.48 15.4 16.10 13.69 BSG 1.00 7.3
Net Assets per Ordinary Share Along with return on capital employed this is a good measure of whether the company is adding value for shareholders. Ordinary Shareholders Funds No. of ordinary Shares in issue at year end
GKN 94 - 95 1995 926.2 = £2.65 349 1994 799.8 = £2.30 346.7
Gross Dividend Yield Amount of dividend paid expressed as a percentage of share price. Dividend paid x 100 Share price
GKN 95 1995 30 = 2.6% 11.50
Dividend Cover Represents the security of the dividend payment Earnings per Share Net Dividend per Share
GKN 94 - 95 1995 57.3 = 2.38x 24 1994 35.4 = 1.74x 21.5