Download
1 / 25
260 likes | 271 Views
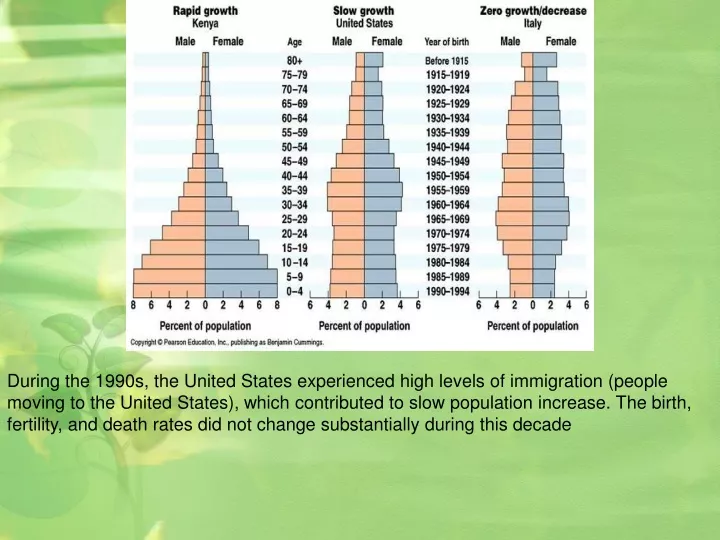
During the 1990s, the United States experienced high levels of immigration (people moving to the United States), which contributed to slow population increase. The birth, fertility, and death rates did not change substantially during this decade. Population Dynamics. Population:

E N D
During the 1990s, the United States experienced high levels of immigration (people moving to the United States), which contributed to slow population increase. The birth, fertility, and death rates did not change substantially during this decade
Population Dynamics • Population: • All the individuals of a species that live together in an area • Demography: • The statistical study of populations, allows predictions to be made about how a population will change
Population Dynamics • Three Key Features of Populations • Size • Density • Dispersion
Factors Limiting Growth Rate • Declining birth rate or increasing death rate are caused by several factors including: • Limited food supply • The buildup of toxic wastes • Increased disease • Predation A limiting factor is something that limits population growth. Food, water, and living space are all examples of limiting factors. Without access to these resources, populations cannot grow and eventually decline
Three Key Features of Populations Size: number of individuals in an area
Three Key Features of Populations • Growth Rate: • Birth Rate (natality) - Death Rate (mortality) • How many individuals are born vs. how many die • Birth rate (b) − death rate (d) = rate of natural increase (r)
Three Key Features of Populations Density: measurement of population per unit area or unit volume Pop. Density = # of individuals ÷ unit of space
Carrying Capacity (k): The maximum population size that can be supported by the available resources There can only be as many organisms as the environmental resources can support Carrying Capacity Carrying capacity is the maximum population size that an environment can support. In general, populations increase when they are below the carrying capacity because there are plenty of resources available for the entire population. However, populations decrease when they are above carrying capacity because resources are not available for everyone
How Do You Affect Density? • Immigration:movement of individuals into a population • Emigration: movement of individuals out of a population • Density-dependent factors:Biotic factors in the environment that have an increasing effect as population size increases (disease, competition, parasites) • Density-independent factors:Abiotic factors in the environment that affect populations regardless of their density (temperature, weather)
Factors That Affect Future Population Growth Immigration + + - Population Mortality Natality - Emigration
Doubling time is the period of time required for a population to double in size. Measuring the doubling time of a population requires that the growth rate be constant over long periods of time
Three Key Features of Populations • Dispersion: describes the spacing of organisms relative to each other • Clumped • Uniform • Random
How Are Populations Measured? • Population density = number of individuals in a given area or volume • Count all the individuals in a population • Estimate by sampling • Mark-Recapture Method
How Do Populations Grow? • Idealized models describe two kinds of population growth: • Exponential Growth 2. Logistic Growth
Exponential Growth Curve Figure 35.3A
Reproductive Strategies • Short life span • Small body size • Reproduce quickly • Have many young • Little parental care • Ex: cockroaches, weeds, bacteria
Reproductive Strategies • Long life span • Large body size • Reproduce slowly • Have few young • Provides parental care • Ex: humans, elephants
Age Distribution • Distribution of males and females in each age group of a population • Used to predict future population growth
In the United States women had fewer children in 1995 than in 1955 (the baby boom era). Also, women are having children later in life; there is a clear shift away from women having children in their early twenties in 1955 to women now having children in their early thirties
Human Population Growth • J curve growth • Grows at a rate of about 80 million yearly • r =1.3% • Why doesn’t environmental resistance take effect? • Altering their environment • Technological advances • The cultural revolution • The agricultural revolution • The industrial-medical revolution
The Human Population • Doubled three times in the last three centuries • About 6.1 billion and may reach 9.3 billion by the year 2050 • Improved health and technology have lowered death rates