Download
1 / 27
280 likes | 412 Views
The Queen City and Sparta GAMs Strengths & Limitations for Groundwater Management. Van Kelley, Neil Deeds & Dennis Fryar INTERA Inc. November 19, 2004. Texas Groundwater 2004 Towards Sustainability. Acknowledgements. TWDB S. Wade, C. Ridgeway, R. Mace Bureau of Economic Geology

E N D
The Queen City and Sparta GAMsStrengths & Limitations for Groundwater Management Van Kelley, Neil Deeds & Dennis FryarINTERA Inc.November 19, 2004 Texas Groundwater 2004 Towards Sustainability
Acknowledgements • TWDB • S. Wade, C. Ridgeway, R. Mace • Bureau of Economic Geology • J.P. Nicot and A. Dutton • RJ Brandes Company • J. Machin and G. Bruehl
Outline of Presentation • Introduction to Queen City & Sparta GAMs • Improvements to Carrizo-Wilcox GAMs • GAMs and Groundwater Management • GAM Strengths • Illustrative Example • Limitations of Applicability • Conclusions
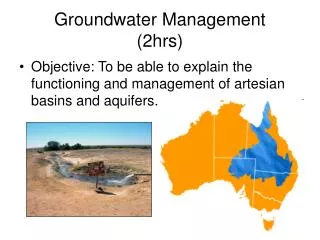
GAM Objectives • Develop realistic and scientifically accurate GW flow models representing the physical characteristics of the aquifer and incorporating the relevant processes • GAMs are designed to be tools to help GWCDs, RWPGs, and individuals assess groundwater availability through 2050 based upon current data
Model Stratigraphy 5 6 7 8
Queen City and Sparta aquifers • 1997 Use QC – 14,000 AFY Sparta – 6,800 AFY • Availability QC – 680,000 AFY SP – 160,000 AFY
Model Domains – Same as C/W GAMs Northern Model Area Gonzales Nixon 20,000 acres represents Approximately 5 grid blocks Central Model Area Southern Model Area Grid - 1 square mile each Same Grid as Carrizo-Wilcox GAMs
Queen City and Sparta GAM Status • Queen City and Sparta GAMs have been completed and submitted to TWDB for approval: • Calibrated to specifications: • pre-development • transient conditions (1980-1989) • verified from (1990-1999) • Developed a consistent recharge distribution across CZWX and QCSP in Texas • Developed consistent parameterization between GAMs in the overlap
Consistent Properties - Statewide Recharge Hydraulic Conductivity
Regions of Applicability • Recommendation by the model developers • If modeling the Simsboro, always use the Central GAM
Management Concepts • Sustainability is a “value laden concept” Allay and Leake (2004) • Sustainable yield is an idea which has evolved and currently is a socioeconomic concept which may include consideration of: • Aquifer dynamics • Human and ecological impacts, and • Economic impacts • Bredehoeft has defined sustainable development from an aquifer dynamics perspective to be a condition when pumping can be balanced by natural aquifer discharge.
Aquifer Dynamics Pre-development recharge discharge Dynamic equilibrium: Aquifer recharge is balanced by aquifer discharge aquifer Post-development pumping Dynamic equilibrium: Pumping is balanced by a Reduction in discharge and in some cases an increase in recharge – sometimes termed “capture” recharge discharge aquifer After Alley et al, (1999) and Bredehoeft (2002)
Sources of Groundwater Availability C B from Alley et al, (1999)
GAM - Strengths • Provide a means to perform regional groundwater management • Provides a physical description of impacts of development describing • Sources of recharge • Sources of capture • Timing of capture • Groundwater storage • Provides key inputs to the definition of availability or sustainability • Without management framework, cannot determine availability or sustainability
GAM Groundwater Management Example • Develop ~5,000 AFY in the outcrop of the Queen City near a major river • Seven wells on one mile spacing • How can the GAM provide understanding for this development scenario?
County Flow Balance (AFY) – Year 0 Recharge 4,649 ET 919 Sparta Pumping 184 Cross Flow 1,373 Unconfined Queen City Grid Cell Confined Queen City Grid Cell Baseflow 1,407 Downdip 2,060 Storage = 82 Cross Flow 1,387 Carrizo
County Flow Balance (AFY) – Year 100 Recharge 4,649 ET 629 Sparta Pumping 4,470 Cross Flow 1,958 Unconfined Queen City Grid Cell Confined Queen City Grid Cell Baseflow 1,146 Storage = 533 Carrizo Cross Flow 1,172
County Transient Flow Balance (AFY) Storage Streams Pumping One well goes dry
Sources of Capture (AFY) Streams 2,552 (3.52 cfs) Sparta 585 ET 302 60% 14 % 7 % Pumped additional 4,285 AFY 11 % 4 % Storage 451 Downdip 180 Carrizo 215 5 %
What did we learn? • Production is not physically sustainable (ie. available capture exists and water levels would stabilize) within 50 years • It would take > 50 years to see the ultimate impact of the development • It would be a good idea to refine the GAM grid, and possibly properties if available, in the vicinity of the development and stream
GAM Strengths for Groundwater Management • The GAM is well suited for studying institutional water resource issues • The GAM provides regional water balance information which can be used to assess: • Regional aquifer dynamics • Regional aquifer capture • Physical inputs to the determination of sustainability • The GAM allows regional consideration of interference between resource strategies • The GAM is well suited for refinement to address local-scale water resource questions.
Limitations & Applicability of the GAM • The GAM is a tool limited to groundwater assessments at the regional scale • The model is not well suited for studying operational water resource issues • The model would require refinement to study operational issues for a specific project • Our example is a case-in-point where refinement of the model in the vicinity of the well field and river would be warranted • GAMs have not been developed to assess water quality issues
Grid Impacts on Drawdown Predictions • Most GAMs developed to date have used a grid size of one square mile • As a result, the GAM model will not predict head drawdown at a specific pumped well Re = 0.198 x K = 15 ft/day b = 600 ft S = 0.0018
Error and Uncertainty • The calibration of GAMs, and most models, is assessed through the model misfit to observations. • In the GAMs we use the Root Mean Square Error (RMSE) as one of our calibration measures • These typically range from 20 to 35 feet • The GAMs are only as accurate at reproducing heads, on average, as the magnitude of the RMSE • The RMSE only describes the average misfit in the calibration or validation periods • The RMSE only provides a measure of the potential predictive error if future conditions are unchanged
Conclusions • GAMs are tools that can be used for regional institutional groundwater assessments • Issues of sustainability or availability require a management framework • GAMs only describe the physical constraints for aquifer management within any given management framework
Conclusions • A primary value of a model, regardless of the predictive accuracy, is it allows for a disciplined format for the improvement of the understanding of an aquifer (Konikow, 1995) • All models, including GAMs, are uncertain and require updating based upon revised conceptual models and new data