Download
1 / 37
380 likes | 620 Views
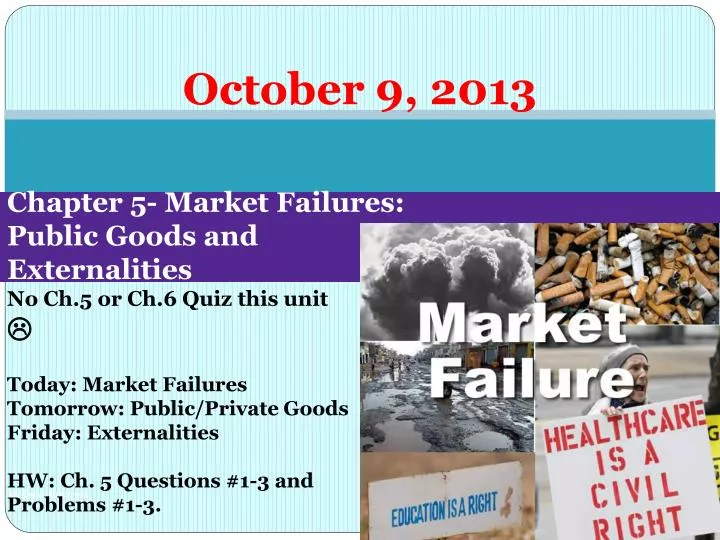
October 9, 2013. Chapter 5- Market Failures: Public Goods and Externalities. No Ch.5 or Ch.6 Quiz this unit Today: Market Failures Tomorrow: Public/Private Goods Friday: Externalities HW: Ch. 5 Questions #1-3 and Problems #1-3. McGraw-Hill/Irwin. Market Failures.

E N D
October 9, 2013 Chapter 5- Market Failures: Public Goods and Externalities No Ch.5 or Ch.6 Quiz this unit Today: Market Failures Tomorrow: Public/Private Goods Friday: Externalities HW: Ch. 5 Questions #1-3 and Problems #1-3. McGraw-Hill/Irwin
Market Failures • Competition among buyers and sellers may not be enough to guarantee that a market will allocate its’ resources correctly. • Market failures sometimes happen in competitive markets. • Something prevents equilibrium...that is Qd does not equal Qs. • Market fails if optimal allocation of resources is not attained (over-allocated or under-allocated) • Leads to government intervention! • 2 categories of market failures… 5-2 LO1
1. Demand-Side Failures • Sometimes it is impossible to charge consumers what they are willing to pay for a commodity. • Some can enjoy benefits without paying. • i.e. Private fireworks shows • When a demand curve does not accurately reflect consumers willingness to pay. 5-3 LO1
2. Supply-Side Failures • Occurs when a firm does not pay the full cost of producing its output. • i.e. Coal burning power plant • When the external costs of producing the good are not reflected in the supply curve. 5-4 LO1
Efficiently Functioning Markets • In a perfect world… • Demand curve must reflect the consumers full willingness to pay • Supply curve must reflect all the costs of production. 5-5 LO1
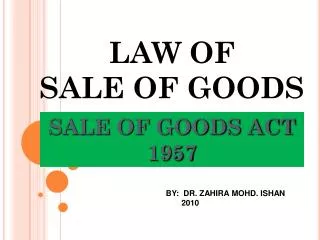
Consumer Surplus • Difference between what a consumer is willing to pay for a good and what the consumer actually pays. • Extra benefit from paying less than the maximum price (utility surplus.) 5-6 LO2
5-7 LO2
Price (per bag) Quantity (bags) Consumer Surplus Consumer Surplus Equilibrium Price P1 D Q1 5-8 LO2 LO2
Producer Surplus • Difference between the actual price a producer receives and the minimum price they would accept • Extra benefit for producer from receiving a higher price 5-9 LO2
5-10 LO2
Price (per bag) Quantity (bags) Producer Surplus Producer surplus S P1 Equilibrium price Q1 5-11 LO2 LO2
Price (per bag) Quantity (bags) Efficiency Revisited All free-markets yield consumer and producer surpluses! This equilibrium reflects optimal economic efficiency. Demand Curves are MB Curves Supply Curves are MC Curves Equilibrium is MB=MC Max. willingness to pay = Min. acceptable price TS is @ Maximum! Consumer surplus S P1 Producer surplus D Q1 5-12 LO2
Efficiency Losses (Deadweight Losses) Producing at Q1 IS OPTIMAL a Efficiency loss from underproduction S Sum of consumer and producer surplus is now adec. d b Price (per bag) e D c Q2 Q1 Triangle DBE shows DEADWEIGHT loss of net benefits to society. Quantity (bags) 5-13 LO2
Efficiency Losses (Deadweight Losses) a S Efficiency loss from overproduction f b Price (per bag) g Triangle BFG subtracts from the ABC producer/consumer surplus Q1 to Q3, costs exceed benefits; poor use of resources D c Q1 Q3 Quantity (bags) 5-14 LO2
October 10, 2013 • HW Check • PS, CS, DL Practice • Public and Private Goods Notes Handout • Finish Practice Problems
Private Goods • Produced in the market by firms (cars, clothes, computers, etc.) • Offered for sale • Characteristics: • Rivalry (if one buys, not available to another person) • Excludability (you no get if you can’t afford) 5-16 LO3
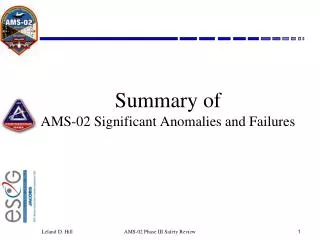
Public Goods • Provided by government • What is optimal amount to produce? • Government estimation (MB=MC) • Create Collective Willingness to Pay curve. • Offered for free (national defense, street lights, etc.) • Characteristics: • Non-rivalry • Non-excludability • Free-rider problem 5-17 LO3
5-18 LO3
P $9 7 5 3 1 0 Q 1 2 3 4 5 P $6 5 4 3 2 1 0 Q 1 2 3 4 5 P $6 5 4 3 2 1 0 Q 1 2 3 4 5 Demand for Public Goods Benson’s Demand $4 for 2 Items D2 $2 for 4 Items Benson Adams’ Demand $3 for 2 Items S Curve measures society MC of each unit Optimal Quantity $1 for 4 Items D1 Adams S Collective Demand $7 for 2 Items Collective Willingness To Pay $3 for 4 Items DC Connect the Dots Collective Demand and Supply 5-19 LO3
Cost-Benefit Analysis • Used for deciding whether to provide a particular public and how much to provide. • Cost • Resources diverted from private good production • Private goods that will not be produced • Benefit • The extra satisfaction from the output of more public goods MARGINAL COST-MARGINAL BENEFIT RULE 5-20 LO3
5-21 LO3
Quasi-Public Goods • Could be provided through the market system, BUT TOO MAN YPEOPLE SEE BEENFITS OTHER THAN INDIVIDUAL BUYER (police, fire dept, roads, etc.) • The government provides them • More examples: education, streets, libraries 5-22 LO3
October 11, 2013 • Collect Current Event • Review Problems Packet Solutions • Externalities…oh boy… • HW: Read chapter 5 and do problems #4-7 and both externality AP Exam practice problems on handout.
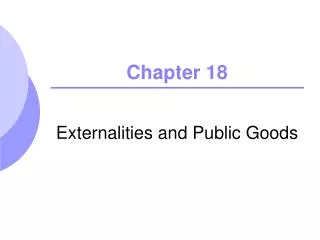
Externalities • Externality: Cost or benefit that “spills over” to a third party external to a transaction. • Can be positive or negative. • Leads to government intervention as resources are not being allocated efficiently! • Positive externalities (spill-over benefits) • Vaccinations…gardens…people going to college…walking to work • Marginal Social Benefit GREATER than Marginal Private benefit. • Underproduction and Under-consumption. • Demand curves DO NOT reflect 3rd party willingness to pay, only MPB (Not MSB) • Negative externalities (spill-over costs) • Factory pollution…barking dogs…late night neighbor’s stereo…second-hand smoke… • Overproduction and Over-consumption • Marginal Social Cost GREATER than Marginal Private cost. • Supply curves DO NOT reflect total costs on society (MSC), only MPC 5-24 LO4
P P 0 Q Q Externalities Note: the demand curve is to the left of the total-benefit demand curve Equilibrium output is less than optimal output Note: Equilibrium Output Is larger than Optimal output MB exceeds MC for all units produced between Qo and Qe Deadweight loss is Triangle abc. Negative Externalities S St (MSC) y b z a Positive Externalities S (MPC) Dt x c D (MSB) D Overallocation = Overproduction Underallocation= Underproduction 0 Qo Qe Qe Qo Qeis less than Qo, deadweight loss is xyz. (a) Negative externalities (b) Positive externalities 5-25 LO4
EDUCATION Marginal Private Cost Price Marginal Private Benefit Quantity provided
STEEL PRODUCTION Marginal Private Cost Price Marginal Private Benefit Quantity provided
Government Intervention • Bring in the government if externalities affect large numbers of people… • Correct negative externalities (over-allocation): • Direct controls (Legislation!) • Specific taxes • Correct positive externalities (under-allocation): • Subsidies (gov’t discounts or payments to producers and consumers) and government provision (offer for free) 5-32 LO4
P P 0 0 Q Q Government Intervention Negative Externalities Tax shifts Supply Curve from S to St St St b a a S S T c D D Overallocation Qo Qe Qo Qe (a) Negative Externalities (b) Correct externality with tax 5-33 LO4
Government Intervention Subsidy per-unit amount S S S y Subsidy z S't Positive Externalities Dt Dt x Subsidy U D D D Underallocation 0 0 0 Qe Qo Qe Qo Qe Qo (a) Positive Externalities (b) Correcting via a subsidy to consumers (c) Correcting via a subsidy to producers 5-34 LO4
Society’s Optimal Amounts MC Socially Optimal Amount Of Pollution Abatement Society’s Marginal Benefit and Marginal Cost of Pollution Abatement (Dollars) MB 0 Q1 5-35 LO5
Government’s Role in the Economy • Government can have a role in correcting externalities • Officials must correctly identify the existence and cause • Has to be done in the context of politics 5-36 LO5
Controlling Carbon Dioxide Emissions • Cap and trade • Sets a cap for the total amount of emissions • Assigns property rights to pollute • Rights can then be bought and sold • Carbon tax • Raises cost of polluting • Easier to enforce 5-37