Download
1 / 10
140 likes | 617 Views
Independent vs. Dependent Variable. Dependent Variable. Independent Variable. Independent vs. Dependent Variable. If you have categories use a bar graph. Dependent Variable. Independent Variable. Color of Paper vs. Score on a Test. If you have categories use a bar graph. Score on a Test.

E N D
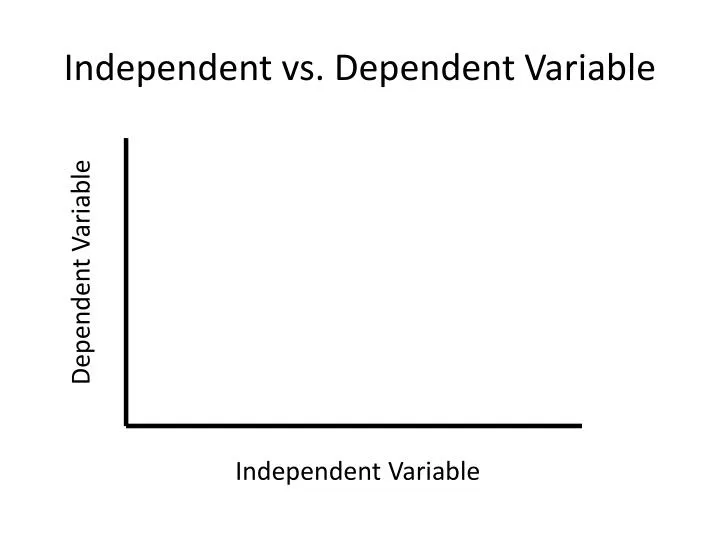
Independent vs. Dependent Variable Dependent Variable Independent Variable
Independent vs. Dependent Variable If you have categories use a bar graph Dependent Variable Independent Variable
Color of Paper vs. Score on a Test If you have categories use a bar graph Score on a Test Blue Green Yellow Color of Paper
Color of Paper vs. Score on a Test Graph the average (mean) Include a range (high and low) Score on a Test Blue Green Yellow Color of Paper
Independent vs. Dependent Variable If you have quantities use a best-fit line graph Dependent Variable Independent Variable
Ramp Height vs. Time If you have quantities use a best-fit line graph Evenly space the numbers Time to roll down the ramp (s) Always start with zero! 5 10 15 20 25 Height of a ramp (cm)
Ramp Height vs. Time If you have quantities use a best-fit line graph Time to roll down the ramp (s) 5 10 15 20 25 Height of a ramp (cm)
Ramp Height vs. Time Put dots for each data point Time to roll down the ramp (s) 5 10 15 20 25 Height of a ramp (cm)
Ramp Height vs. Time Draw a line that best fits your data Time to roll down the ramp (s) 5 10 15 20 25 Height of a ramp (cm)
Independent vs. Dependent Variable Dependent Variable Independent Variable

![The Impact of [independent variable] On [dependent variable] Controlling for [control variable]](https://cdn0.slideserve.com/430545/the-impact-of-independent-variable-on-dependent-variable-controlling-for-control-variable-dt.jpg)