Download
1 / 46
460 likes | 512 Views
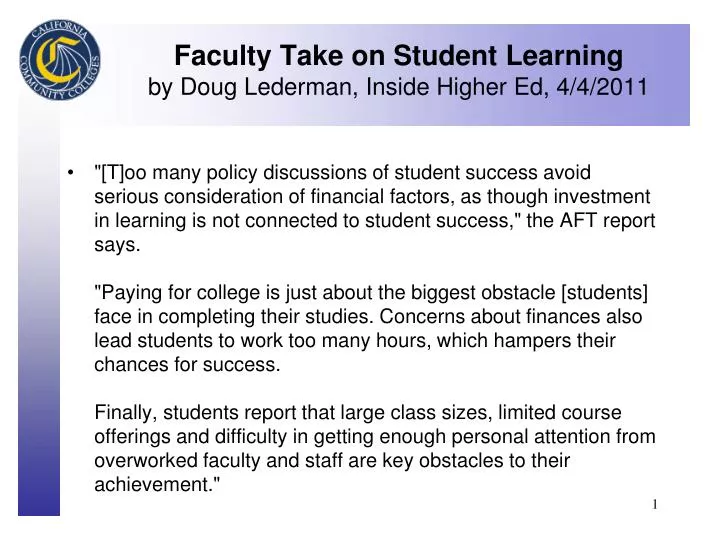
Faculty Take on Student Learning by Doug Lederman , Inside Higher Ed, 4/4/2011 .

E N D
Faculty Take on Student Learning by Doug Lederman, Inside Higher Ed, 4/4/2011 "[T]oo many policy discussions of student success avoid serious consideration of financial factors, as though investment in learning is not connected to student success," the AFT report says. "Paying for college is just about the biggest obstacle [students] face in completing their studies. Concerns about finances also lead students to work too many hours, which hampers their chances for success. Finally, students report that large class sizes, limited course offerings and difficulty in getting enough personal attention from overworked faculty and staff are key obstacles to their achievement."
Research & Planning Group 2011 RP Conference Checking the Progress of CTE Student Growth using Perkins Core Indicators, Reports, and Targets Dr. Chuck Wiseley CTE Specialist, CCCCO
Department XYZ - 1 • 4,500 enrollments in department • 55% successful course completions • 3 courses in Subject Area A eligible as electives in AA • 30% successful completion • Problems with sequences (prereqs?) but with • Greater number of successful units increased likelihood of successfully earning greater numbers of units
Department XYZ - 2 At what point are students in a program in the XYZ department? At what point does the department believe student outcomes and program outputs are impacted by the instruction in XYZ? What are some of the measures that we can use to see whether students are progressing through the XYZ program?
Department XYZ - 3 We might ask: Are the students getting through our courses? Are there or what are the gateway courses? Are students able to persist from term-to-term or year-to-year? Do they complete our programs by earning an award (are awards conferred)? Is there gender equity and diversity in the program through to completion? Do students find employment or advance in their careers?
Progress Checks in Perkins • Program Participants: • Successful course completions – GPA • Persistence in Higher Ed • Completions • Employment • Gender Equity • Participation • Completions • Special Populations • No ethnic distribution reports yet
Agenda • Perkins IV • Data, • Cohort Selection, • Core Indicators, • Reports, • Performance Targets, • Perkins funds: • improving student success
Data Flow: College Data collection Types of data
Data Flow: Chancellor’s Office MIS database DSS: CalWORKs EDD: UI wages NSC: transfers Research & Accountability Advisory Committee Perkins IV - USDE/OVAE State Plan Non regulatory guidance OMB “Official Documents” Consolidated Annual Report District MIS Chancellor’s Office MIS SSN based data matches Accountability Framework & Report Specifications CO MIS Programming Funding Reports Accountability Reports
The magic happens here! Chancellor’s Office Management Information Systems (MIS) Group District data Perkins counts
MIS Data Data Elements Funding Accountability Core Indicator Data
Defining the Data • SAM Codes • TOP Codes • Data Elements • Core Indicators • “The Law” • Definitions • Negotiated Performance Targets • Measurement Approaches/Formulas Funding
Student Accountability Model (SAM) & Taxonomy of Programs (TOP) • Priority “A“ - Apprenticeship • Must have the of the Division of Apprenticeship Standards approval • Priority “B“ – Advanced Vocational • Used sparingly, no more than two courses in any one program • “B” level courses must have a “C” prerequisite in the same program area • Priority "C" – Clearly Occupational • Generally taken in the middle stage of a program, detracts "drop-ins." Job specific skills.
Student Accountability Model (SAM) & Taxonomy of Programs (TOP), Continued • Priority "D" – Possibly Occupational • Taken by students in the beginning stages of their occupational programs • Can be survey or intro course • Priority “E” = Non-Occupational Vocational Flag on TOP code • Designed to identify vocational “Programs” for federal reporting (*) - see Taxonomy of Programs, Sixth Edition, Sept. 2009
Data ElementsMIS System • Students, Courses, Degrees, Services • Student VTEA Data Elements • Economically Disadvantaged • Single Parent • Displaced Homemaker • Cooperative Work Experience Education • Tech Prep • Migrant Worker - Implementation in MIS SU 09
Section IE-D 2011-2012 Sample College
Accountability Requirements Section 113(b) 5 core indicators of performance: • Student attainment of technical skill proficiencies; • Student attainment of credential, certificate, or degree; • Student retention in postsecondary education or transfer; • Student placement in military, apprenticeship, or employment • Student participation/completion of non-traditional training State and Local adjusted levels of performance • Levels of performance negotiated with USDE / State Results reported annually
Perkins IV (2006) Core Indicators • Technical Skill AttainmentSuccessful CTE course completion (GPA) • CompletionsProgram completion–Certificate, Degree & Transfer Ready • Persistence & TransferStudent persistence in Higher Ed • PlacementPlacement in apprenticeship, employment, military, fed gov • Gender Equity -- Nontraditional FieldsParticipation (5a)/Completion (5b) - nontraditional “fields”
Cohort Definitions Used for Measurement Participant: • Counts: - Any enrollment in a CTE course (SAM A-D) – funding & Feds • NT Participation: Concentrator using assigned major (changed from III) Concentrator: All Core Indicators • Cohort of participants enrolled during the cohort year* and • Successfully completed at least one course in the middle or end of a program (SAM A-C) and • 12 vocational units (SAM A-D) within a single discipline (two digit TOP) in the last three years • or • Program completion as indicated by receipt of ANY vocational credit certificate or degree in the cohort year (or subsequent year /wo *) Leavers: Not enrolled in the year following the cohort year Life-Long-Learners (LLL): Previously Earned Certificate or Degree
Assigning a Program Area (TOP)to a Student • Award – TOP code of CTE Certificate or Degree • Concentrators (no CTE award) • Hierarchy based on SAM Priority code • SAM A, then B, then C • Assigned to the TOP where most CTE units occurred
My Numbers Don’t Look Right- Recap • Reasons for 80 in the Total, rather than the 500 students I see in my classes(or 170 of the 4,500): • 12 CTE units (SAM A-D) within a 2-digit TOP in the last 3 years • Plus, At least one course at a SAM A-C • Assigning a TOP by highest SAM • Excluding Life-Long-Learners (unless appropriate)
Timeline for Outcomes & Outputs Negotiated Performance 2010-11 Negotiated Spring 2010 Reports published in Spring 2011 Cohort Year (2008-09) +1 yr for outcomes (2009-10) Transfer Persistence Employment Not OLD DATA – as recent as possible Outcomes have already occurred Target low performance now!
Timeline for Outcomes, Outputs, & Investments You are here Three years of enrollment for 09-10
Core Indicator 1Technical Skill Attainment • All Concentrators • Technical Skill Proficiencies • Successful Course Completions • Vocational (CTE) Courses • SAM A-C • Vocational TOP • G.P.A. • Grade reports (Use - Data Mart - 4 digit TOP)
Core Indicator 1: Measurement SAM A - C Courses: # Student concentrators with GPA > 2.00 ÷ # Students concentrators with Grades A – F Excludes students with only CR/NC or P/NP grades in SAM A-C courses
Core Indicator 2Program Completions • Completers (numerator) • Transfer Ready (or Transfer Program Completers) • Award in Current Year • AA/AS degrees • Certificates • Award in subsequent year with no Voc coursework • or Equivalent • Leavers & Completers (denominator) • Left system (college) for one year and/or • Award in Current Year • AA/AS degrees • Certificates • Transfer Ready • Award in subsequent year with no Voc coursework • Removed Persisters & Life-Long-Learners
CI 2-Completions: Measurement Certificate/Degree/Transfer Ready ÷ Concentrators (Leavers & Completers), Not Persisters or LLL (without new awards)
Core Indicator 3Persistence & Transfer (or Continuing in Higher Education) Concentrators who were not leavers in the year following the cohort year or Transfers to CCC/CSU/UC/Privates (National Student Clearinghouse) ÷ All Concentrators who were not completers with degrees or certificates (unless transferring)
Core Indicator 4Placement • Placement • Leavers and Completers • Minus leavers continuing in Two or Four Year Institutions • CCC or National Student Clearinghouse • Employment 1st year out • UI wage file match • Employment any quarter in Academic Yr after cohort year Apprenticeship, Military, Fed GovNote: The denominator for 4P1 includes completers who stayed but does not include Transfer Ready who stayed.
CI 4 Placement: Measurement Leavers & Completers in UI covered employment or Apprenticeship, Military, Fed Gov ÷ All Leavers & Completers (Leavers) Note: The denominator for 4P1 includes completers who stayed but does not include Transfer Ready who stayed.
Core Indicator 5Gender Equity Programs leading to Nontraditional Fields (e.g., Men in Nursing – Women in Auto) 75% / 25% from 2000 census employment data • NAPE developed Nontraditional CIP table • Job codes (SOC) mapped to 2000 Census data • SOC codes mapped to CIP (USDE) • CIP codes mapped to TOP (CCC)
Core Indicator 5Gender Equity Programs leading to Nontraditional Fields Nontraditional Gender Students ÷ All Students in NT Program
CI 5a: NonTradParticipation Measurement Nontraditional Concentrators in a Nontraditional TOP Code ÷All Concentrators in a Nontraditional TOP Code
CI 5b NonTrad Completion: Measurement Nontraditional “Completers” of Nontraditional Programs ÷ All “Completers” of Nontraditional Programs
Report Structures • Negotiation Workbooks – Take a look • FAUPL negotiation worksheet • Perkins IC - Local Application • Forms – Take a look • Perkins IC - Local Application • Targets and Performance • Trend Reports – Take a look • Percents and counts for 3 years • Detailed breakouts for each Indicator component • Summary Reports – Take a look • All five Indicators on one page • Answer sheet style by TOP only (2, 4,& 6) • Detail Reports with counts, Special Pops, District, & State by TOP • Special Population Reports • Similar to Summary Reports by Each Population Subgroup
Access • http://www.cccco.edu • Chancellor’s Office • Divisions • > CTE • >> Core Indicators • Important Documentation • Accessing Negotiation Reports • Accountability Framework • Assigning majors • State Negotiated Targets • System Documentation • Email notification when available
Negotiating Targets State negotiates targets USDE Next 2 years In Process Worksheets without state targets are available now State Targets will be provided when available Locals either: Accept state targets Negotiate local targets Targets Included in Local Plans Targets for next year Negotiations complete by May 15
Effects of not achieving 90% of targets • Above 90% of targets: • Freedom to fund any CTE program improvements • Encouraged to address low performance • Below 90% - year 1 • Focused Improvement section • Requires some analysis • target interventions • write the narrative • Must address low performance in funded Programs • Encouraged to start a diagnostic study
Effects of not achieving 90% of targets continued... • Below 90% in year 2 or no improvement • Focused Improvement section • Diagnostic study • Propose Effective Practice solutions • Probably a more district level approach to expenditures
Effects of not achieving 90% of targets continued... • Below 90% of target - 3 years • Focused Improvement section • Submit Diagnostic study w/ Action Plan to CO • Action Plan • Proposed Effective Practice solutions & Implementation dates • Probably an even more district level approach to expenditures • Risk Monitoring
Resources & Questions? • Nontraditional Resources: • Joint Special Populations Committee (JSPAC.org), • Institute for Women in Trades, Technology & Science (IWITTS.com), • National Alliance for Partnerships in Equity (NAPE.org) • Journals & Papers • RP Group • Research, Analysis, and Accountability Unit • Abstracts(?), Papers, & Notices • CTE – Core Indicators Web page • Documentation, Papers, Training/Tutorials (PPT, WMF, & CCC Confer) • Questions: • Your CCCCO Monitor • Chuck Wiseley - cwiseley@cccco.edu, • 916.327.5895