Download
1 / 68
690 likes | 693 Views
This is my project report. <br>I did my internship in Sharekhan. And i did my Industrial Internship Program(IIP) project on SAVING AND INVESTMENT PATTERN OF TEACHERS IN HYDERABAD CITY - A SURVEY. This report explains on the saving and investment behavior of the teachers in Hyderabad city. Research had been conducted by primary survey. in this report we can understand about the sharekhan company, How it came into existence, its competitors, and parent company. this survey explains about the monthly saving and expenditure of teachers.

E N D
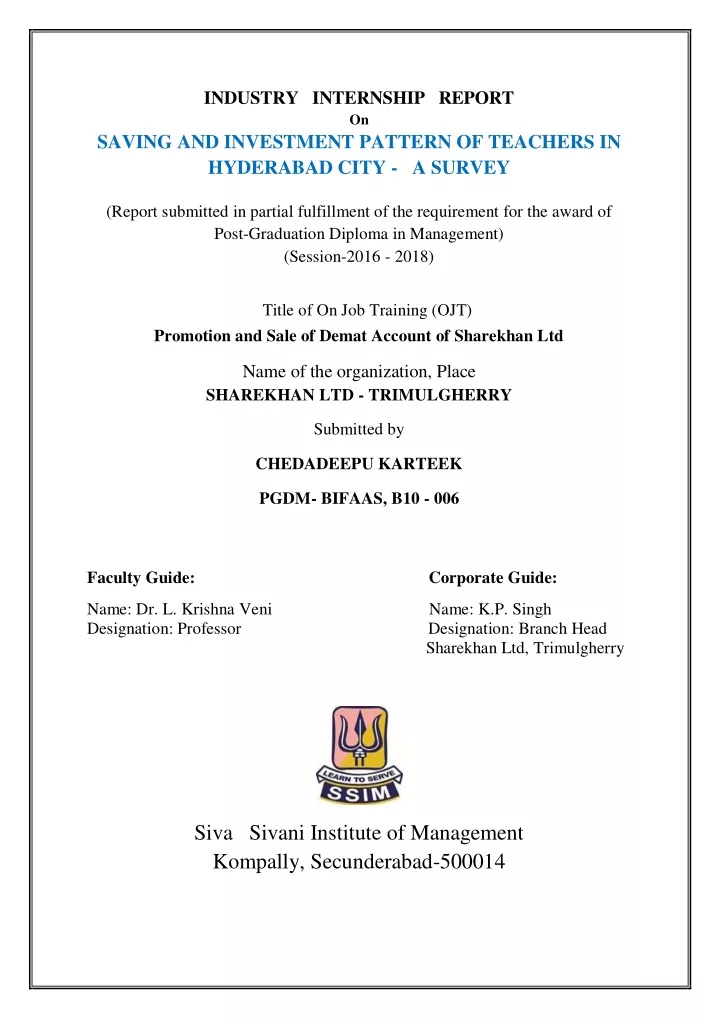
INDUSTRY INTERNSHIP REPORT On SAVING AND INVESTMENT PATTERN OF TEACHERS IN HYDERABAD CITY - A SURVEY (Report submitted in partial fulfillment of the requirement for the award of Post-Graduation Diploma in Management) (Session-2016 - 2018) Title of On Job Training (OJT) Promotion and Sale of Demat Account of Sharekhan Ltd Name of the organization, Place SHAREKHAN LTD - TRIMULGHERRY Submitted by CHEDADEEPU KARTEEK PGDM- BIFAAS, B10 - 006 Faculty Guide: Corporate Guide: Name: Dr. L. Krishna Veni Name: K.P. Singh Designation: Professor Designation: Branch Head Sharekhan Ltd, Trimulgherry Siva Sivani Institute of Management Kompally, Secunderabad-500014
INDUSTRY INTERNSHIP REPORT On SAVING AND INVESTMENT PATTERN OF TEACHERS IN HYDERABAD CITY - A SURVEY (Report submitted in partial fulfillment of the requirement for the award of Post-Graduation Diploma in Management) (Session- 2016 - 2018) Title of On Job Training (OJT) Promotion and Sale of Demat Account of Sharekhan Ltd Name of the organization, Place SHAREKHAN LTD - TRIMULGHERRY Submitted by CHEDADEEPU KARTEEK PGDM- BIFAAS, B10 - 006 Faculty Guide:Corporate Guide: Name: Dr. L. Krishna Veni Name: K.P. Singh Designation: Professor Designation: Branch Head Sharekhan Ltd, Trimulgherry Siva Sivani Institute of Management Kompally, Secunderabad-500014 2
DECLARATION I Mr. KARTEEK CHEDADEEPUdeclare that this project titled “SAVING AND INVESTMENT PATTERN OF TEACHERS IN HYDERBAD CITY – A SURVEY” is the original work done by me under the guidance of Dr. L. Krishna Veni, Professor (Designation), Social Sciences (Dept.),Siva Sivani Institute of Management, Secunderabad. I further declare that it is the original work made by me as a part of my Post Graduate Diploma in Management. Date: Signature of the student: Place: Secunderabad Name of the student: Ch Karteek 3
ACKNOWLEDGEMENT The ideal way to begin documents this research would be, to extent of my heartfelt gratitude to everyone who has encouraged and guided me all through my project in particular. I would like to thank to Mr K.P Singh, Inspite of his busy schedule helped and guided me, throughout my project. I offer my deep sense of gratitude to our beloved and respected guide Mrs Dr. L. Krishna Veni, Professor for having guided me in utmost inspiring way that has led me to complete this work, successfully and sufficiently in time. I take this opportunity to thank the management staff of Siva Sivani Institute of Management, Kompally for giving this opportunity to so this project and for their endless support. KARTEEK Date: Name of the Student: Place: Secunderabad. 4
TABLE OF THE CONTENT Chapter No Content Page Numbers Brief Report On Job Training(OJT) Introduction 7 – 21 Chapter I Chapter II 22 – 29 Review of Literature 30 – 32 Chapter III Chapter IV Chapter V Research Methodology Data Analysis Summary and Conclusions References 33 – 37 38 – 62 63 – 67 68 5
LIST OF FIGURES Number Title of the Figure Page Number I. Profile of the Respondents 39 40 41 42 43 44 45 46 47 48 I.1 I.2 I.3 1.4 I.5 I.6 I.7 I.8 I.9 I.10 Age composition of the Respondents Gender of the Respondents Marital status of the Respondents Educational Qualifications of the Respondents Type of organization where the Respondents are working Years of teaching experience in of the Respondents Designation Level of the Respondents Family size of the Respondents Source of income of the Respondents Monthly income of the Respondents II. SAVING AND INVESTMENT ATTRIBUTE Spending monthly income of the Respondents Share of Saving of the Respondents Saving and invested for fist time of the Respondents Getting Investment information of the Respondents How do you invest your savings? Saving and Expenditure proportion of the Respondents Types of Investment of the Respondents Investment Objective of the Respondents Manage investment by Respondents Have you invested your savings so far Instrument Preference of the Respondents Reasons for saving of the Respondents II.1 II. 2 II.3 II.4 II.5 II.6 II.7 II.8 II.9 II.10 II.11 II.12 49 50 51 52 – 53 54 55 56 57 58 59 60 61-62 6
INTERNSHIP DETAILS Company: Sharekhan Limited Location: Trimulgherry, Hyderabad. Duration of internship: 8th May 2017 to 22nd June 2017 TITLE OF OJT: Promotion and sale of Demat Accounts of Sharekhan Ltd TARGETS: 1.To promote the sales of the Demat Account to new customers and to find out the feedback from the existing customers through cold calling in Hyderabad. 2.To sell at least 5 to 10 Demat Accounts to the perspective investors in the Hyderabad city. ACHIEVEMENTS: 1.I talked with 400 new customers and the existing customers of Sharekhan Ltd from the data base provided by my corporate guide. 2.I have educated the customers and sold 11 Demat accounts and surpassed the given target. Learning Outcomes: 1.I understood all about share market and different segments of financial markets through lectures demonstration by industry guide. 2.I gained knowledge about various different segments of financial market like share, bonds, debentures, mutual funds, equities commodities etc.,. 3.Through cold calling, I interacted with 400 out of 600 customers from the given data base and promoted for the sales of demat account and to promote the sales of the different financial products through Sharekhan Ltd 4.I understood how to speak with customers and promote the products through cold calling based on the needs and moods of the customers. 5.I understood that promotion of the business through cold calling is a tough task, after taking to some of the customers, who are very rude and tough. 6.I understood that, I should be patience to hear complaints/grievances of the existing customers. 7.I have noted down all the issues raised by the customers and taken them to the notice of higher- ups for the adequate customer care. 8.I talked with different customers in different languages like Telugu, Hindi, and English etc. However, I faced difficulties to speak with different people with different languages, but understand the need to learn multiple languages to succeed in the business matters. 9.I have utilized my relatives, family friends, and my own friends to convince the benefits of financial investments through demat account. 8
10.Initially, I thought that it will be a tough task to sell 5 Demat Accounts, but later on I have succeeded in my efforts and I sold 11 (beyond given targets) Demat Accounts beyond the given target of 5. LIMITATIONS: 1.I faced language difficulty while talking to different customers in a city like Hyderabad, where the cosmopolitan culture is very much predominant. 2.Some of the customers are not lifted the phone in spite of respected efforts. Some of them have not responded to my inquiry and suddenly telephonic talk. 3.I understand that some of the customers are impatient and reluctant towards my calling 4.I understand the practical difficulties involved in the promotion and selling of financial products and services 9
INTRODUCTION OF THE COMAPANY Sharekhan Ltd is one of the top retail brokerage houses in India with a strong online trading platform. The company provides equity based products (research, equities, derivatives, depository, margin funding, etc.). It has one of the largest networks in the country with 1200+ share shops in 400 cities and India’s premier online trading portal www.sharekhan.com. With their research expertise, customer commitment and superior technology, they provide investors with end-to-end solutions in investments. They provide trade execution services through multiple channels - an Internet platform, telephone and retail outlets. Sharekhan was established by Morakhia family in 1999-2000 and Morakhia family continues to remain the largest shareholder. It is the retail broking arm of the Mumbai-based SHRIPAL SHEWANTILAL KANTILAL ISWARNATH LIMITED [SSKI] Group. SSKI which is established in 1930 is the parent company of Sharekhan ltd. With a legacy of more than 80 years in the stock markets, the SSKI group ventured into institutional broking and corporate finance over a decade ago. Presently SSKI is one of the leading players in institutional broking and corporate finance activities. Sharekhan offers its customers a wide range of equity related services including trade execution on BSE, NSE, and Derivatives. Depository services, online trading, Investment advice, Commodities, etc. Sharekhan Ltd. is a brokerage firm which is established on 8th February 2000 and now it is having all the rights of SSKI. The company was awarded the 2005 Most Preferred Stock Broking Brand by Awaaz Consumer Vote. It is first brokerage Company to go online. The Company's online trading and investment site - www.Sharekhan.com - was also launched on Feb 8, 2000. This site gives access to superior content and transaction facility to retail customers across the country. Known for its jargon-free, investor friendly language and high quality research, the content-rich and research oriented portal has stood out among its contemporaries because of its steadfast dedication to offering customers best-of-breed technology and superior market information. Sharekhan has one of the best states of art web portal providing fundamental and statistical information across equity, mutual funds and IPOs. One can surf across 5,500 companies for in-depth information, details about more than 1,500 mutual fund schemes and IPO data. One can also access other market related details such as board meetings, result announcements, FII transactions, buying/selling by mutual funds and much more. 10
Sharekhan's management team is one of the strongest in the sector and has positioned Sharekhan to take advantage of the growing consumer demand for financial services products in India through investments in research, pan-Indian branch network and an outstanding technology platform. Further, Sharekhan's lineage and relationship with SSKI Group provide it a unique position to understand and leverage the growth of the financial services sector. We look forward to providing strategic counsel to Sharekhan's management as they continue their expansion for the benefit of all shareholders. SSKI Corporate Finance Private Limited (SSKI) is a leading India-based investment bank with strong research-driven focus. Their team members are widely respected for their commitment to transactions and their specialized knowledge in their areas of strength. The team has completed over US$5 billion worth of deals in the last 5 years - making it among the most significant players raising equity in the Indian market. SSKI, a veteran equities solutions company has over 8 decades of experience in the Indian stock markets. If we experience their language, presentation style, content or for that matter the online trading facility, we'll find a common thread; one that helps us make informed decisions and simplifies investing in stocks. The common thread of empowerment is what Sharekhan's all about. Sharekhan is also about focus. Sharekhan does not claim expertise in too many things. Sharekhan's expertise lies in stocks and that's what he talks about with authority. So when he says that investing in stocks should not be confused with trading in stocks or a portfolio- based strategy is better than betting on a single horse, it is something that is spoken with years of focused learning and experience in the’ stock markets. And these beliefs are reflected in everything Sharekhan does for us! Sharekhan is a part of the SSKI group, an Indian financial services power house, with strong presence in Retail equities Institutional equities Investment banking. In Ahmedabad, It is having the branch at Dynamic house, opp. Child care hospital, Navrangpura road and over 40 franchisees in Ahmedabad. We have been given the centre at Navrangpura road, Ahmedabad. Sharekhan has always believed in investing in technology to build its business. The company has used some of the best-known names in the IT industry, like Sun Microsystems, Oracle, Microsoft, Cambridge Technologies, Nexgenix, Vignette, Verisign Financial Technologies India Ltd, Spider Software Pvt Ltd. to build its trading engine and content. Previously the 11
Morakiya family holds a majority stake in the company but now a world famous brand CITI GROUP has taken a majority stake in the company. HSBC, Intel & Carlyle are the other investors. With a legacy of more than 80 years in the stock markets, the SSKI group ventured into institutional broking and corporate finance 18 years ago. Presently SSKI is one of the leading players in institutional broking and corporate finance activities. SSKI holds a sizeable portion of the market in each of these segments. SSKI’s institutional broking arm accounts for 7% of the market for Foreign Institutional portfolio investment and 5% of all Domestic Institutional portfolio investment in the country. It has 60 institutional clients spread over India, Far East, UK and US. Foreign Institutional Investors generate about 65% of the organization’s revenue, with a daily turnover of over US$ 4 million. The Corporate Finance section has a list of very prestigious clients and has many ‘firsts’ to its credit, in terms of the size of deal, sector tapped etc. The group has placed over US$ 1 billion in private equity deals. Some of the clients include BPL Cellular Holding, Gujarat Pipavav, Essar, Hutchison, Planetasia, and Shopper’s Stop. SHANTILAL SHEWANTILAL KANTILAL ISWARNATH LIMITED (SSKI LTD) group of companies: 1.SSKI Investors Service Limited( SHAREKHAN) 2.S.S Kanthilal Iswarlal Securities. 3.SSKI corporate finance. 4.I dream productions 5.Palm spring estates PVT limited. 6.Fin flow investment PVT limited. 7.I dream productions UK PVT limited 8.Share khan commodities PVT limited 9.Archfund properties PVT limited Vision To be the best retail broking brand in the retail business of the stock market Mission 12
To educate and empower the individual investor to make better investment decisions through quality advices and superior services. OBJECTIVES: 1.To project Sharekhan Ltd as an authority in the retail stock trading business. 2.To execute business for the company by selling Demat Accounts and mutual funds. 3.To study the various products of the company. 4.To know how to open and close the calls. 5.To learn the online terminal used for trading. 6.To know the various policies of the company. 7.To know how to handle various types of customers. 8.To know various reasons for market fluctuations. 9.To learn to manage time. 10.To gain practical knowledge of the market, And to have a practical experience of working. SHAREHOLDING PATTERN (2016) HOLDINGS SHAREHOLDERS CITI Venture Capital and other Private Equity Firm 81% IDFC 9% Employees 10% 13
PROFILE OF THE COMPANY Name of the company: Share khan Ltd. Year of Establishment: 1925 Headquarter: Share khan SSKI A-206 Phoenix House Phoenix Mills Compound Lower Parel Mumbai - Maharashtra, INDIA- 400013 Nature of Business : Service Provider Services: Depository Services, Online Services and Technical Research. Number of Employees : Over 3500 Website : www.sharekhan.com Slogan : Your Guide to The Financial Jungle MANAGEMENT TEAM: NAME DESIGNATION Mr. Shripal Morakhia Chairman Mr. Jaideep Arora CEO Mr. Rahul Yadav Online Sales Head Mr. Sumeet Narang DP Head Mr. Thiruvidaimarudhur Sivashankar DP Head Mr. Hemendra Aggarwal Cluster Head Mr. Amit pal Singh and Regional Sales Manager Mr. Maneet Rastogi Regional Sales Manager 14
Hierarchy of Sharekhan Ltd CEO Vice President Assistant Vice President Country head Regional Sales Manager (Branch manager) Area Sales Manager Territory manager Assistant sales manager/IINI Sales Assistant Manager/ Relationship Manager/Equity Advisor Senior Sales Executives Sales Executive/ Dealer Super Trainees Trainees 15
SHAREKHAN SUBSIDARIES: The major subsidiaries of sharekhan as follows: 1.Sharekhan Limited, Asset Management Arm 2.Sharekhan Limited Research Design 3.Sharekhan Commodities Private Limited 4.Sharekhan Financial Service Private Limited PRODUCTS AND SERVICES OFFERD BY SHAREKHAN Share online & offline Derivatives Mutual fund online Commodities online IPO online Portfolio Management Services Insurance Fixed deposits Advisory products Currency trading SHAREKHAN HAS TIE UP WITH THE FOLLOWING BANKS: 1.HDFC Bank 2.CITI Bank 3.OBC Bank 4.YES Bank 5.UTI Bank 6.IDBI Bank 7.ICICI Bank 8.Union Bank 9.Indus Ind Bank 16
10.Bank of India 11.Deutsche Bank MAJOR FUCTIONAL AREAS OF SHAREKHAN: Sharekhan Ltd occupies first place in non-banking services and it is second largets company overall. It has about 1.4 million client bases. 1.Administration: Administrative department performs functions like setting up of the branches, event management of branch signboards, interior designing and branch location. 2.Compliance/Risk: It takes care of client risk associated with their Demat Accounts, NSE risk and compliances. 3.Finance: It looks after budget passing and all the financial matters associated with sharekhan Ltd. 4.Human Resources: HR department takes care of recruitment and payable section of sharekhan Ltd. 5.Operations: It looks after KYC norms, Account opening and closure functions of Sharekhan Ltd. 6.CRM and Analytics: It deals with software development and customer service. 7.Digital Asset: It deals with the development of digital platform. 8.Digital Marketing: It undertakes the working of advertisement, campaigns, which are based on the Sharekhan Ltd. 9.Digital setup: Deals with technology development, Invention of new tools. 10.Brand: It undertakes branding, advertising services etc. 11.Advisory: Advisory services provided by the sharekhan mainly give advices to the customer on their investment option based on their performance. 17
12.Client Acquition: All the sales aspect of the organization would be directed by the client acquition team. SHAREKHAN ACCOUNTS SHERKHAN PROVIDES 4 IN ONE ACCOUNTS: 1.Demat Account 2.Trading account from cash calculations 3.Bank account for fund transfer 4.Dial and trade for query relating trading Share khan provides two different accounts: 1)Classic account 2)Trade Tiger CLASSIC ACCOUNT:- The Classic Account enables customers to trade online on the NSE and the BSE, invest in IPO and Mutual Funds and access all the research and transaction reports through Sharekhan’s website. This account is suitable for the retail investors. In this account Shown the maximum script are 25 in the terminal and the technical chart are not shown in this account. The life time registration charge for this account is 750 rupees. TRADE TIGER: Trade tiger is a next-generation online trading product that brings the power of broker’s terminal to customer pc. It is session to capitalize on intra-day price movement. Trade tiger is an internet –based application available on a CD, which provides everything a trader needs on one screen. STRATEGY: The main strategies used in the training program are as follow. DATA CALLING From the provided data of mobile numbers I made tele calls to many existing and perspectivw investors to improve the business. 18
Apart from given data we also brought latest business directory. We called to different business people and tried to generate appointments. COLD CALLING Called calling means to go at different corporate houses and to meet different People and to get their visiting card by it we get lead and our immediate task Was to call them & to fix appointment. ACHIEVEMENTS OF SHAREKHAN: 1.RATEDamongthe top20 wired companies along with reliance, HUJI, Infosys, etc. by “Business Today”, January 2004 edition 2.Awarded “top domestic brokerage house” four times by euro money and Asia money. 3.Pioneers of online trading in India amongst the top 3 online trading websites from India. Most preferred financial destination amongst online broking customers. 4.Winners of a ‘best financial website” award. 5.India’s most preferred brokers within 5 years. Awaaz customer award. II. CUSTOMERS: Business class people (high class) High Net worth Individuals Service class people Government Employees Young Adults (19-30 yrs.) Adults (35-50 yrs.) HUF (Hindu Undivided Family) Women (literate and working) III. COMPETITORS: 1.Karvy Stock Broking Ltd 2.India Infoline 3.ICICIDirect 4.India Bulls 5.Reliance Money 6.Kotak Securities 7.Motilal Oswal 19
8.Anand Rathi 9.Religare Enterprises 10.HDFC Securities Every industry is subjected to different type of environments such as political, economic, social, technological/ tax internal and legal (PESTIL). i. Political Environment: financialtransactions and investments are subjected to political environment and stability of the country. ii. Economic factors: the financial investment are very much associated with budgetary decisions of the central government, business cycle and their implications, besides macro-economic like monetary and fiscal policies and decide the volume of the financial transactions. These policies should target to maintain economic stability in the country. iii. Social environment: the changing the social scenario of the economy also reflects the financial transactions and investment of the people of the society. iv. Technological/ Tax Environment: sometimes the technological environment also may create a significant impact on the share market, mutual funds or any other financial products. v. Internal/ International/ Industrial Environment: sudden developments both in domestic and global environment fronts, the financial health’s of the economy may be subjected too many of changes on financial and money markets. Further industrial recession or boom also may lead to some changes. vi. Legal Environment: changing legal environment may promote the business or hamper the business. This is may lead to significant changes in any business. Mainly the financial markets are subjected to may radical changes in the business. After November 8th 2016 demonetization of the currency had erased for many radical changes in the economy subsequently digitalization of all financial transactions was made mandatory to curb the problems of the black money in the country. I.SWOT ANALYSIS: TheSWOT Analysis of SSKI Ltd can be briefly summarized as follows: Strengths: 1.Wide range of innovative financial products 2.Big client base 3.In-house research house 4.online as well as offline trading 5.Online IPO/ MF services 6.Share shops 7.Transparent 20
8.User friendly tie ups with 10 banks 9.Excellent order execution speed and reliability WEAKNESS 1.Lack of awareness among customer 2.Less focus on customer retention 3.Less exposure OPPORTUNITIES: 1.Improve Web based trading 2.Focus on Institutional investors 3.Concentrate on HNI (HIGH NET WORTH INVESTOR) 4.Educated people THREATS 1.Aggressive promotional strategies by close competitor like Religare, Angel Broking and India bulls 2.Entry of foreign finance firms in Indian Market 3.Lack of sufficient branch office for speedy delivery of services. 21
CHAPTER – I INTRODUCTION 22
SAVING Savings is the portion of income not spent on current expenditures. Because a person does not know what will happen in the future, money should be saved to pay for unexpected events or emergencies. And the amount which is kept aside for the future use it may not have a Return. In a simple macroeconomics model, with no government spending, and no international sector, we have: Y = C + S, where S = personal saving, Y = Real GDP and C - Real Consumption Spending. Real GDP measures as a flow of earning is either consumed or saved. INVESTMENT In the general terms investment refers to the keeping our money in the financial assets and keeping in somewhere else. The invested amount can increased for the future. It may have return also. Sectorial Composition of Saving: Gross Domestic savings accrue from three sectors i. Government or public sector ii. Private corporate sector iii. The household sector The public sector includes government administration, departmental undertakings, government companies and statutory corporations. The private corporate sector comprises of non-government non-financial corporate enterprise. The rest is termed household sector. Thus, the household sector, being residual in character, includes a host of economic agents who engage in production/consumption activity. Among the three sectors, as in most other countries, the household sector in India too contributes the bulk-more than two-third of the total savings. The government sector and the corporate sector contribute the balance, i.e. about one-third of total saving in the country. Source of savings: Main sources of savings in India are as follows: 1)Household Savings: The household sector is the largest contributor to domestic saving. It is important as it reflects how efficiently savings are converted into investment with the role of financial sector’s intermediation in the process. These sectors include the saving of: a.Households (families), b.Non-Profit institutions like collage, hospitals, etc. c.Non-corporate business unit. 23
Household savings can be divided into three parts, as follows: a.Physical Assets: The physical assets include housing, machinery, furniture, fixture and real estate. b.Financial Assets: This takes the form of currency, bank deposits, shares and debentures, claims on government, mutual funds, national savings certificates, life insurance funds and provident and pension funds. c.The Unaccounted Savings of the Household Sector: The unaccounted savings of the household sector are always kept in the form of gold, silver and durable goods on which information is very scanty. However, on the basis of estimates the proportion of these assets is placed in a range of 3 to 10 per cent of the GNP in any year. 2)Government Savings: Government savings come from surpluses of public enterprises and other public financial institutions. Government savings formed 7.4 per cent of GDP in the economy. Among the factors responsible for this trend, the most important are: a.Deterioration in the overall tax GDP ratio, and b.The increasing losses over time made by public sector utilities such as state Electricity and Water Boards, State Road transport Corporation, and the Railways. 3)Private Corporate Savings: The share of private corporate sector in total savings was 9.4 per cent. This, however, came down to 7.4 per cent. But it has been moving upwards since then, reaching at of 8.24 per cent. In developed countries, the corporate sector has contributed, significantly to national savings, while it has not done so in India, in spite of the development within the secondary and tertiary sectors of the economy and the significant increase in manufactured output. This is attributed to the following factors: a.Massive increase in the use of loan capital in Indian industry and the fall in the share of profits in factor incomes b.Significant position of the unincorporated private sector in Indian manufacturing and commerce which is reflected in household savings and not in the ‘private corporate savings’; and c.The taxation policy, which discourages the accumulation of undistributed profits in companies and corporations coupled with a low profitability syndrome. Different national saving schemes offered by the Central Government: 1.Post Office Saving Account: This account offers an interest rate of 3.5% per annum on both the individual as well as joint account. The tenure for this account is not fixed. The account can be opened by investing any amount, subject to a minimum of Rs.50 to a maximum of 24
Rs.1 lakh for individual account and Rs.2 lakhs for joint account. Cheque and Debit card Facility is also available to this product. 2.Kisan Vikas Patra(KVP): The Kisan Vikas Patra (KVP) is one of the premier and popular saving scheme offering from the Indian Postal Department. This product has had a very chequered history- initially successful, deemed a product that could be misused and thus terminated in 2011. 3.Sukanya Samriddhi Account: Saving scheme offering from the Indian Ministry of Finance, the Sukanya Samriddhi Yojana (SSY) Accounts are aimed at ensuring a bright future for the girl children in India. 4.Atal Pension Yojana: It is one of India’s most popular erstwhile Prime Ministers, the Atal Pension Yojana is aimed squarely at the weaker sections of the society as well as those individuals who can benefit from a government sponsored welfare program. 5.National Pension System: This scheme is available to the employees of the state and central Government organizations, employees of corporate and MNC entities, individuals as well as workers from the various unorganized sectors. 6.Voluntary Provident Fund: The term ‘voluntary’ signifies willingly or doing something when guided by their own free will. The concept of Voluntary Provident Fund (VPF) draws on this, wherein the subscriber willingly contributes up to 100% of their basic salary and dearness allowance into their respective Employee Provident Fund (EPF), instead of the usual 12%. 7.Deposit Scheme for Retiring Government Employees This scheme is particularly targeted to benefit retiring public sector employees. 8.Seniors Citizen Saving Scheme (SCSS): This saving scheme option is exclusively to senior citizens in India Types of Investment: 1.Autonomous Investment Investment which does not change with the changes in income level is called as Autonomous or Government Investment. Autonomous Investment remains constant irrespective of income level. Which means even if the income is low, the autonomous, Investment remains the same. It refers to the investment made on houses, roads, public buildings and other parts of Infrastructure. The Government normally makes such a type of investment. 2.Induced Investment 25
Investment which changes with the changes in the income level, is called as Induced Investment. Induced Investment is positively related to the income level. That is, at high levels of income entrepreneurs are induced to invest more and vice-versa. At a high level of income, Consumption expenditure increases this leads to an increase in investment of capital goods, in order to produce more consumer goods. 3.Financial Investment Investment made in buying financial instruments such as new shares, bonds, securities, etc. is considered as a Financial Investment. However, the money used for purchasing existing financial instruments such as old bonds, old shares, etc., cannot be considered as financial investment. It is a mere transfer of a financial asset from one individual to another. In financial investment, money invested for buying of new shares and bonds as well as debentures have a positive impact on employment level, production and economic growth. 4.Real Investment Investment made in new plant and equipment, construction of public utilities like schools, roads and railways, etc., is considered as Real Investment. Real investment in new machine tools, plant and equipment purchased, factory buildings, etc. increases employment, production and economic growth of the nation. Thus real investment has a direct impact on employment generation, economic growth, etc. 5.Planned Investment Investment made with a plan in several sectors of the economy with specific objectives is called as Planned or Intended Investment. Planned Investment can also be called as Intended Investment because an investor while making an investment makes a concrete plan of his investment. 6.Unplanned Investment Investment done without any planning is called as an Unplanned or Unintended Investment. In unplanned type of investment, investors make investment randomly without making any concrete plans. Hence it can also be called as Unintended Investment. Under this type of investment, the investor may not consider the specific objectives while making an investment decision. 7.Gross Investment Gross Investment means the total amount of money spent for creation of new capital assets like Plant and Machinery, Factory Building, etc. It is the total expenditure made on new capital assets in a period. 8.Net Investment Net Investment is Gross Investment less (minus) Capital Consumption (Depreciation) during a period of time, usually a year. It must be noted that a part of the investment is meant for depreciation of the capital asset or for replacing a worn-out capital asset. Hence it must be deducted to arrive at net investment. 26
Importance of Investment 1.Financial Independence: First and the foremost thing is an investment gives you financial freedom. If we invest money from the beginning then we need not to worry about the future financial needs. 2. Increases Wealth: Besides making you financially independent, investment makes you rich also. As you invest more and more money for a long time, it will definitely make you richer. In the present generation, it is of utmost importance to be rich as it gives more benefit in each and every aspect of your life. 3.Fulfilling Personal Goals: If you have a desire for having a luxurious apartment and a luxurious car of your own, then it is obvious that these desires may be fulfilled by a planned investment and savings. As you invest more, you tend to become richer. And as you become richer, you may find no difficulty in achieving your personal goal. 4.Reduce Future Risk: If we do investment from the beginning then we can get money of investment in future and so that our future will become safe and our future risk also reduce. Investment Avenues Lowest Investment Risk Instruments Bank Deposits Certificate of Deposits Commercial Papers Treasury Bills Government Bonds Moderate Risk Instruments Corporate Bonds Mutual Funds Exchange traded Funds Convertible Bonds Real Estate Gold High risk Instruments Equity - Investment in Stocks Futures Arts and collectibles Non-Convertible Debentures Real Estate Foreign Exchange Trading 27
Here we can discuss some very mostly preferable investment avenues in the details as below Equity: Equity is an investment avenue which is able to offer the highest possible returns but is very risky as there are huge probabilities of investors even losing some part of the invested capital too. This can offer returns in range of 15- 50% annually in good times and negative returns of 5-15% also. Mutual Funds: A mutual fund is a collection of stocks and bonds. When you buy a mutual fund, you are pooling your money with a number of other investors, which enables you to pay a professional manager to select specific securities for you. The primary advantage of a mutual fund is that you can invest your money without the time or the experience that are often needed to choose a sound investment. Bonds: The term bond is commonly used to refer to any securities that are founded on debt. When you purchase a bond, you are lending out your money to a company or government. In return, they agree to give you interest on your money and eventually pay you back the amount you lent out. The main attraction of bonds is their relative safety. The safety and stability, however, come at a cost. Because there is little risk, there is little potential return. The return from bonds ranges between 7-10% annually. Real Estate: Anyone can also invest in real estate. This investment offers attractive return. But the price fluctuation in bad times very high. And one needs lakhs of rupees to get started in this market. Fixed Deposits: One can opt to invest in fixed deposits. The investments into fixed deposits offer normal returns and low risks. The investments into fixed deposits are available in forms of bank fixed deposits, post office fixed deposits, and company fixed deposits. Insurance: Insurance has become one of the most important investment avenues in India. Unit Linked Insurance Plans are very popular in India besides the traditional endowment policies. Provident Funds: This is one of the safest long term investment options. This is mainly for retirement purpose. Gold: This Avenue is very popular in India. Gold as an investment option has the moderate risk and one big thing is that it is in the physical form so, mostly Indian people prefer. Investment strategies Understanding of the investment choices available, that may come across specialized terms that explain how money can be invested: Allocation of Investments: 28
Also known as asset allocation, this term refers to the types of investments/asset categories you own and the percentage of each you have in your investment portfolio. Diversification: This is a risk management technique that mixes a wide variety of investments to potentially minimize your investment risk. Cost Averaging: An investment strategy used whereby an investor purchases fixed investment amounts at predetermined times, regardless of the price of the investment. Investment can be classified under three heads: a)Ownership Investment: They are the most volatile and profitable class of investment. Generally they are in the form of I. Stocks II. Business III. Real Estates IV. Precious Objects b)Lending Investment: They lend to be the lower risk than the ownership investments and return less as result. These are mostly associated with Saving Account and Bonds. c)Cash Equivalents: These are ‘as good is cash’, which means they are easy to convert back into cash. Money market funds are the best example of this category. 29
CHAPTER – II REVIEW OF LITERATURE 30
This chapter makes an attempt to review few of studies on saving and investment briefly as follows: Harshvardhan N. Bhavsar (2013) made an attempt to determine the relationship between the savings and investments pattern among the school teachers. It shows the significant relationship with the income and saving. The study was done on the different government and private school teachers. The teaching community has started realizing the importance of money and money’s worth. They are initiated to prepare a budget for the proposed expenses and compare it with the actual expenses met by them, so that they are not influenced by other tempting and fashionable expenses. This study concludes that mainly linked the main avenues of investment are in form of bank deposits. It is evident from the study undertaken that most of the teachers are saving their money for the purpose of their children’s education, marriage and other welfare expenses. Varsha Virani (2013), exposed that the study which reveals the savings and investment pattern in the Rajkot city. It shows the major impact on savings is due to the level of income of the school teachers. In spite of low income the teachers have been saving for future needs. To improve the living standard of people has been increasing day by day. They avoid spending money on heavy luxurious life style and preferring the normal living standard. This research the majority of the respondents are saving money in the form of Bank deposits for the safety of an unpredictable future. The main investments are bank deposits. this study concludes that in their study explain that main purpose of investment is for children education, marriage, and security after retirement. D. Umamaheswari, and K. Suganthi (2012), exposed the study was to determine the relationship between the savings and investments pattern among the school teachers. It was done on the different government and private school teachers. The teachers have been saving for future needs. Today the teaching community has started realizing the importance of money. The budget which is proposed expenses as compare with the actual expenses met by teachers, it not influenced by other tempting and fashionable expenses. The study shows that the majority of the teachers are saving money in the form of bank deposits, gold, post office deposits and LIC. Maheswari (2016) reveals in her study that most of the respondents earning capacity is less, even if they earned more they distributed only minimum portion of their income to saving. Number of respondents invested in the form of financial assets is high but amount invested in financial assets is less. Respondents are selected only from rural area are having low income people, less educated, not well employed and they contributed to bank deposit, post office and life insurance and not to mutual fund, shares, debenture, bonds and lack of awareness on new schemes and opportunities in financial assets leads to reduce the investments in higher risk financial assets. 31
L. Pandiyan and T. Aranganathan (2013), in their study it is examined by seven underlying dimensions of savings and investments, Secured Life, Avoiding investments in Private parties and Companies, Lack of guidelines to children about saving, Tough Task but good for future, Creation of Awareness about saving habit by Government, Savings Requires Experience and Wrong investment decision by many. The study shows the respondents have high the status of attitude about all aspects except Tough Task but good for future are high. Regarding “Tough Task but good for future”, the respondents that are found with moderate attitude. Deepak Sood and Dr. Navdeep Kaur (2015), has reveals in their study that relationship between Annual Savings and Age, Income, Sector wise Employment, Education of people at Chandigarh. It was propounded here that the most preferred investment options are LIC and bank deposits and most of the factors influencing investment decisions were high returns, tax benefit and safety. The study undertaken that most of the people are saving their money for children’s education, marriage and to fulfil the other goals of life. There are bright chances to increase the saving and investment habits of salaried class people at Chandigarh. Dr. Ananthapadhmanabha Achar (2012) studied “Saving and Investment Behaviour of Teachers - An empirical study”. In the analysis individual characteristics of teachers such as age, gender, marital status, and lifestyle determined the savings and investment behaviour of teaching community in the study region. They considered monthly family income, stage of family life cycle, and upbringing status emerged as determinants of their savings and investment behaviour. the attitude of teachers toward consumption, saving and investment would reflect their economic behaviour, which would influence quality of life and in turn influence their profession and the education system. Against this background, this study makes an attempt to examine the savings and investment pattern of teachers working in different educational institutions of Hyderabad city by doing the primary survey. 32
CHAPTER - III RESEARCH METHODOLOGY 33
Objectives of the study: This study has been conducted on selected teachers who are working as teachers, Lecturers and professors in the Hyderabad city. This study covers the teachers (all) working in both public and private sectors. The main objectives of the study are: 1.To examine the demographic profile of the respondents in the Hyderabad. 2.To examine the saving and investment pattern of the teachers working in the Hyderabad City. 3.To understand the perceptions of the teachers working in both private and government sector on the pattern of saving and investment. The present study on Savings and Investments Pattern of Teachers in Hyderabad City The present study is based on the primary data. This study has been conducted on the level of respondents as described below. In this survey, 10 schools, colleges and universities located in the Hyderabad city have been covered. Teachers working in different private and government sector educational institutions of Hyderabad city are considered for this study. This study has classified the respondent teachers into three categories: Higher level, Middle level and Lower Level Higher level respondents are classified as Chairmans, Directors and Head of Departments Middle level respondents are classified as Professors, Assistant professors, lectures. Lower level respondents are classifies as Primary and secondary level teachers. Data Collection: My study is based on the primary data using a questionnaire method. It consists of 26 questions Sample size ---- 100 members Type of sampling - Convenient Sampling Area of study -- Hyderabad city Period of study ---- 5th June 2017 to 1st August 2017 The questionnaire adopted for this study is given as follows: 34
QUESTIONNAIRE ON SAVING AND INVESTMENT PATTERN OF TEACHERS IN HYDERABAD CITY - A SURVEY Dear Sir/Madam, My study for project report is on the Savings and Investments pattern of Teachers in Hyderabad City. I would very much appreciate your co-operation in responding to the questions below. All answers in this questionnaire are used for academic purpose only and will be kept confidential. Kindly cooperate and help me to complete the survey successfully. I. PROFILE: 1.Age: 20 – 30 31 – 40 41 – 50 Above 50 2.Gender: Male Female 3.Marital Status: Married Unmarried 4.Educational qualification: SSC UG PG Professional Others 5.Type of Organization: Private Government. 6.Years of Experience: Less than 5 Years 5 – 10 years 10 – 15 years More than 15 years. 7.Level of Designation: Top Level Middle Level Lower Level 8.Family Size: 0 -3 3 – 6 Above 6 9.Sources of income: Sources of income A)Spouse income B)Income from children C)Agriculture income D)Income from parents E)Rent from house F)Other income (specify) Please tick appropriate 10.Monthly Income: Less than Rs.10, 000 Rs.10, 000 to Rs.30, 000 Rs.30, 000 to Rs.50, 000 Above Rs.50, 000 35
II. SAVING AND INVESTMENT ATTRIBUTES: 1.How do you spend your monthly income? Shopping Investment Saving All of the Above 2.What percentage of your income do you save? 0-10% 10-20% 20-30% 30-40% 3.How much do you invest/ saving/ making financial plan at the first time? Below Rs.5000 Rs.5, 000 – Rs.10, 000 Rs.10, 000 – Rs.50, 000 Above Rs.50, 000 4.Where do you get investment information?(Please tick the following) Friends Internet TV . Newspapers Ads Others Relatives Consultants 5.How do you invest your savings?(please tick) Savings account Mutual Funds and other Investment Schemes Shares, Bonds etc. I do not have any of these investments Pension Fund Real Estate Precious Metals Other 6.What is the proportion of savings and expenditure in your earnings? Savings: Expenditure. 10:90 20:80 30:70 40:60 50:50. 7.Types of Investments: Long term (greater than 3 years) Medium term (1 to 3 year) Short term (less than 1 year). 8.Objective of your investment: Safety Liquidity Return Reliability Low risk Other factors 9.How do you manage your investments? Self-Managed Stock Brokerage Through bank Others (Finan Advi, Agents,) 10.Have you invested your savings so far? Yes No 36
11.If you save, you would prefer instruments which are Low risk Moderate risk High risk 12.If you save, please specify reasons for saving (Tick as many as applicable )Planning for retirement Purchase of Property Marriage of Children To Claim Income Tax Benefit For Children’s education THANK YOU FOR YOUR PATIENCE Tools applied in this study are as follows: The tools which are applied in this study are percentage, averages, pie diagrams, bar diagrams etc. using excel sheets. 37
CHAPTER – IV DATA ANALYSIS 38
This chapter deals with the data analysis part of the research study to analyse the saving investment pattern of the teachers working in Hyderabad city, percentages and appropriate figures have been used at various level, to draw the meaningful inferences. Thus, this chapter provides a detailed picture about the saving and investment pattern of the teachers based on primary data. The analysis under two broad headings namely profile of the respondents and saving and investment attribute in detail. This chapter mainly deals with the data I. Profile of the Respondents Age composition of the Respondents TABLE: I. 1 Age (In Years) % 20 – 30 31% 31 – 40 27% 41 – 50 23% Above 50 19% FIGURE I. 1 Age composition of the Respondents Age 20 - 30 19% 31 - 40 31% 41 - 50 Above 50 23% 27% From Table I. 1 and Figure I. 1, it is clear that out of 100 teachers, 31% are in 20 – 30 age groups, 27% of them are in the 31 – 40 age group, 23% of them are in 41-50 age groups. The remaining 19% of teachers are in the age group of above 50 years. 39
Gender of the Respondents TABLE: I. 2 GENDER % Male 57% Female 43% FIGURE: I. 2 Gender of the Respondents GENDER Male 43% Female 57% From the Table I. 2 Figure I. 2, out of 100 respondents of this study, it is clear that 57% are male teachers and 43% are female teaches considered for this study. 40
Marital status of the Respondents Table: I. 3 MARITAL STATUS Married % 64% Unmarried 36% Figure: I. 3 Marital status of the Respondents MARITAL STATUS 36% Married Unmarried 64% It is evident from Table I. 3 and Figure I. 3, out of 100 teachers, 64% are married and 36% are unmarried teachers are considered for this study. 41
Educational Qualifications of the Respondents TABLE: I. 4 EDUCATIONAL QUALIFICATION SSC UG PG Professional Others PhD % 5% 13% 46% 20% 12% 4% FIGURE: I. 4 Educational Qualifications of the Respondents EDUCATIONAL QUALIFICATION 4% 5% SSC 12% 13% UG PG 20% Professional Others 46% Phd From the Table I. 4 and Figure I. 4, Out of 100 teachers, 46% of teachers are qualified up to Post Graduation, 13% are undergraduates. The teachers with other qualifications are 12% and the teachers having 5% of teachers are with SSC qualification. Ph. D is 4% of teachers considered for the study. 42
TABLE: I. 5 Type of organisation where the Respondents are working % TYPE OF ORGANISATION GOVERNMENT 23% PRIVATE 77% FIGURE: I. 5 Type of organisation where the Respondents are working TYPE OF ORGANISATION 23% GOVERNMENT PRIVATE 77% From the Table I. 5 and Figure I. 5, it is clear that the type of educational organisations considered for this study can be classified into two types. From the above analysis it is evident that 23% of respondents are working in Government organisations and remaining 77% of teachers are working in private organisations. 43
Years of teaching experience in of the Respondents Table: I. 6 YEARS OF TEACHING EXPERIENCE % Less than 5 Years 36% 5 - 10 Years 28% 10 – 15 Years 19% More than 15 years 17% FIGURE: I. 6 Years of teaching experience in of the Respondents More than 15 years 17% 10 - 15 years 19% 5 - 10 Years 28% Less than 5 Years 36% 0% 5% 10% 15% 20% 25% 30% 35% 40% YEARS OF EXPERIENCE From Table I. 6 and Figure I. 6, It is clear that out of 100 respondents, 36% of teachers are having less than 5 years of experience. 28% of them are having 5 to 10 years of experience, and 19% of them are having 10 to 15 years of experience. The remaining 17% of the teachers are having more than 15 years of teaching experience. 44
Designation Level of the Respondents TABLE: I. 7 LEVEL OF DESIGNATION Top Level Middle level Lower level % 16% 55% 29% FIGURE: I. 7 Designation Level of the Respondents LEVEL OF DESIGNATION 16% 29% Top Level Middle level Lower level 55% From Table I. 7 and Figure I. 7, out of 100 respondents, 16% are of them are in top level designation of teachers, it is found that there are 29% teachers in the lower level is at the 29% . However 55% of teachers are in the middle level. Top level people are considered as Head of Departments, Directors, Chairman and principals. Middle level people are Professors, Lectures, and Secondary level teachers. The primary level teachers are considered under Lower level in this study. 45
Family size of the Respondents TABLE: I. 8 FAMILY SIZE 1 – 3 % 40% 4 – 6 49% Above 6 11% Figure: I. 8 Family size of the Respondents FAMILY SIZE 11% 1 - 3 4 - 6 Above 6 40% 49% From Table I. 8 & Figure I. 8, it is clear that 49% of respondents are having 4 – 6 family members. 40% of the respondents are having 1 – 3 family members. But only 11% of the respondents are having above 6 members in their families. 46
Source of income of the Respondents TABLE: I. 9 Source of Income Salary Salary; Agriculture Income Salary; Income from Parents Salary, Spouse Income Salary; Agriculture Income, Rent from House Salary, Spouse Income, Agriculture Income salary; Agriculture income; Income from Parents; Rent from House Salary; Rent from House; Spouse Income, Agriculture Income Salary; Other Income % 46% 17% 6% 10% 6% 3% 5% 4% 3% Figure: I. 9 Source of income of the Respondents Source of Income Salary; Other Income 3% Salary; Rent from House; Spouse Income, Agriculture Income 4% salary; Agriculture income; Income from Parents; Rent from House 5% Salary, Spouse Income, Agriculture Income 3% Salary; Agriculture Income, Rent from House 6% Source of Income Salary, Spouse Income 10% Salary; Income from Parents 6% Salary; Agriculture Income 17% Salary 46% 0% 10% 20% 30% 40% 50% From Table I. 9 and Figure I.9, out of 100 respondents, 46% of the teachers having their salary is major source of 1ncome. 17% of respondents are having salary and agriculture, 6% of respondents are having salary, agriculture income, and income from rent is the source of income. 10% of the respondents are having salary and spouse income is the source of income. 3% of respondents are having salary and other income is source of 1ncome. 4% of respondents are having salary, spouse income, income from agriculture and income rent is the major source of income for the respondents. 47
Monthly income of the Respondents Table: I. 10 MONTHLY INCOME Less than Rs.10, 000 % 9% Rs.10,000 to Rs.30,000 48% Rs.30,000 to Rs.50,000 26% Above Rs.50,000 17% Figure: I. 10 Monthly income of the Respondents MONTHLY INCOME 26% Less than Rs. 10, 000 17% Rs. 10,000 to Rs.30,000 9% Rs. 30,000 to Rs.50,000 48% Above Rs. 50,000 From Table I. 10 and Figure I.10, it is clear that 48% of Teachers are having monthly income of Rs.10,000 to Rs.30,000. 26% of the teachers are having Rs.30,000 – 50,000 as their monthly income. 17% of the teachers are having above Rs.50,000 as their monthly income. But only 9% of teachers are having Less than Rs. 10,000 as their monthly income. 48
II. SAVING AND INVESTMENT ATTRIBUTE Spending monthly income of the Respondents TABLE: II. 1 Spending monthly income Shopping % 11% Savings 39% Investment 7% All of the above 43% Figure: II. 1 Spending monthly income of the Respondents Spending Monthly Income Shopping 11% Savings 43% Investment All of the above 39% 7% From Table II.1 and Figure II.1, out of 100 respondents, 43% of respondents are spending their monthly income in savings, Shopping and Investments. 39% of the respondents are spending their monthly income on the savings. 11% of respondents are spending their monthly income on shopping. 7% of the respondents are are spending their monthly income on the investment. 49
Share of Saving of the Respondents TABLE: II. 2 % Share of savings in income 0 - 10% 26% 34% 10 - 20% 24% 20 - 30% 16% 30 – 40% Figure : II. 2 Share of Saving of the Respondents Share of saving in income 16% 26% 0 - 10% 10 - 20% 20 - 30% 30 – 40% 24% 34% From Table II.2 and figure II.2, it is clear that, 34% of the respondents are used to save 10 – 20% of their income and 26% of respondents are used to save of their income 0 – 10%. 24% of respondents used to save their income at 20 – 30% of their income. But only16% of respondents are used to save their income at 30 – 40%. 50