Download
1 / 1
10 likes | 99 Views
Overview of the GOES-R Proving Ground Activities at the National Hurricane Center. Christopher Velden 1 , Mark DeMaria 2 , John Knaff 2 , Mike Brennan 3 , Jack Beven 3 , Hugh Cobb 3 , Jessica Schauer 3 , Kevin Fuell 4 , Jason Dunion 5 , Michael Folmer 6

E N D
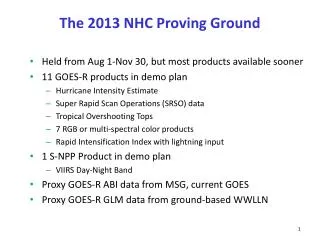
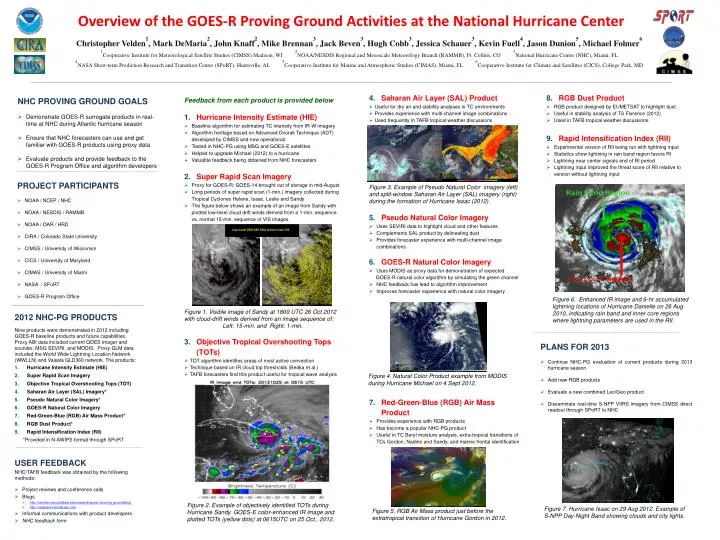
Overview of the GOES-R Proving Ground Activities at the National Hurricane Center Christopher Velden1, Mark DeMaria2, John Knaff2, Mike Brennan3, Jack Beven3, Hugh Cobb3, Jessica Schauer3, Kevin Fuell4, Jason Dunion5, Michael Folmer6 1Cooperative Institute for Meteorological Satellite Studies (CIMSS) Madison, WI2NOAA/NESDIS Regional and Mesoscale Meteorology Branch (RAMMB), Ft. Collins, CO3National Hurricane Center (NHC), Miami, FL 4NASA Short-term Prediction Research and Transition Center (SPoRT), Huntsville, AL5Cooperative Institute for Marine and Atmospheric Studies (CIMAS), Miami, FL6Cooperative Institute for Climate and Satellites (CICS), College Park, MD • Saharan Air Layer (SAL) Product • Useful for dry air and stability analyses in TC environments • Provides experience with multi-channel image combinations • Used frequently in TAFB tropical weather discussions • Figure 3. Example of Pseudo Natural Color imagery (left) and split-window Saharan Air Layer (SAL) imagery (right) during the formation of Hurricane Isaac (2012). • Pseudo Natural Color Imagery • Uses SEVIRI data to highlight cloud and other features • Complements SAL product by delineating dust • Provides forecaster experience with multi-channel image combinations • GOES-R Natural Color Imagery • Uses MODIS as proxy data for demonstration of expected • GOES-R natural color algorithm by simulating the green channel • NHC feedback has lead to algorithm improvement • Improves forecaster experience with natural color imagery • Red-Green-Blue (RGB) Air Mass Product • Provides experience with RGB products • Has become a popular NHC-PG product • Useful in TC Beryl moisture analysis, extra-tropical transitions of TCs Gordon, Nadine and Sandy, and marine frontal identification • RGB Dust Product • RGB product designed by EUMETSAT to highlight dust • Useful in stability analysis of TS Florence (2012) • Used in TAFB tropical weather discussions • Rapid Intensification Index (RII) • Experimental version of RII being run with lightning input • Statistics show lightning in rain band region favors RI • Lightning near center signals end of RI period • Lightning input improved the threat score of RII relative to version without lightning input • NHC PROVING GROUND GOALS • Demonstrate GOES-R surrogate products in real-time at NHC during Atlantic hurricane season • Ensure that NHC forecasters can use and get familiar with GOES-R products using proxy data • Evaluate products and provide feedback to the GOES-R Program Office and algorithm developers • Feedback from each product is provided below • Hurricane Intensity Estimate (HIE) • Baseline algorithm for estimating TC intensity from IR-W imagery • Algorithm heritage based on Advanced Dvorak Technique (ADT) developed by CIMSS and now operational • Tested in NHC-PG using MSG and GOES-E satellites • Helped to upgrade Michael (2012) to a hurricane • Valuable feedback being obtained from NHC forecasters • Super Rapid Scan Imagery • Proxy for GOES-R: GOES-14 brought out of storage in mid-August • Long periods of super rapid scan (1-min.) imagery collected during Tropical Cyclones Helene, Isaac, Leslie and Sandy • The figure below shows an example of an image from Sandy with plotted low-level cloud drift winds derived from a 1-min. sequence vs. normal 15-min. sequence of VIS images. • Objective Tropical Overshooting Tops (TOTs) • TOT algorithm identifies areas of most active convection • Technique based on IR cloud top thresholds (Bedka et al.) • TAFB forecasters find this product useful for tropical wave analysis Low-Level (700-950 hPa) vectors from VIS • PROJECT PARTICIPANTS • NOAA / NCEP / NHC • NOAA / NESDIS / RAMMB • NOAA / OAR / HRD • CIRA / Colorado State University • CIMSS / University of Wisconsin • CICS / University of Maryland • CIMAS / University of Miami • NASA / SPoRT • GOES-R Program Office Figure 6. Enhanced IR image and 6-hr accumulated lightning locations of Hurricane Danielle on 26 Aug 2010, indicating rain band and inner core regions where lightning parameters are used in the RII. 2012 NHC-PG PRODUCTS Nine products were demonstrated in 2012 including GOES-R baseline products and future capabilities. Proxy ABI data included current GOES imager and sounder, MSG SEVIRI, and MODIS. Proxy GLM data included the World Wide Lightning Location Network (WWLLN) and VaisalaGLD360 network. The products: Hurricane Intensity Estimate (HIE) Super Rapid Scan Imagery Objective Tropical Overshooting Tops (TOT) Saharan Air Layer (SAL) Imagery* Pseudo Natural Color Imagery* GOES-R Natural Color Imagery Red-Green-Blue (RGB) Air Mass Product* RGB Dust Product* Rapid Intensification Index (RII) *Provided in N-AWIPS format through SPoRT USER FEEDBACK NHC/TAFB feedback was obtained by the following methods: Project reviews and conference calls Blogs http://rammb.cira.colostate.edu/research/goes-r/proving_ground/blog http://nasasport.wordpress.com Informal communications with product developers NHC feedback form Figure 1. Visible image of Sandy at 1800 UTC 26 Oct 2012 with cloud-drift winds derived from an image sequence of: Left: 15-min. and Right: 1-min. • PLANS FOR 2013 • Continue NHC-PG evaluation of current products during 2013 hurricane season • Add new RGB products • Evaluate a new combined Leo/Geo product • Disseminate real-time S-NPP VIIRS imagery from CIMSS direct readout through SPoRT to NHC Figure 4.Natural Color Product example from MODIS during Hurricane Michael on 4 Sept 2012. Figure 2. Example of objectively identified TOTs during Hurricane Sandy. GOES-E color-enhanced IR image and plotted TOTs (yellow dots) at 0615UTC on 25 Oct., 2012. Figure 7. Hurricane Isaac on 29 Aug 2012. Example of S-NPP Day-Night Band showing clouds and city lights. Figure 5. RGB Air Mass product just before the extratropical transition of Hurricane Gordon in 2012.