Download
1 / 20
200 likes | 279 Views
STOCHASTIC COUPLING OF SOLAR PHOTOSPHERE AND CORONA ( Astrophysical J., 2012, 2013). Vadim M. Uritsky (1,2), Joseph M. Davila (2), Leon Ofman (1), and Aaron J. Coyner (1) (1) Catholic University of America (2) NASA Goddard SFC. The multiscale space environment.

E N D
STOCHASTIC COUPLING OF SOLAR PHOTOSPHERE AND CORONA(Astrophysical J., 2012, 2013) Vadim M. Uritsky (1,2), Joseph M. Davila (2), Leon Ofman (1), and Aaron J. Coyner (1)(1) Catholic University of America(2) NASA Goddard SFC
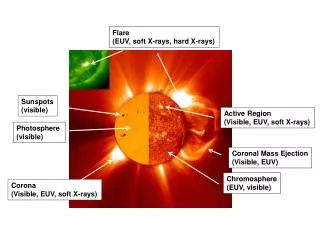
Examples of non-potential coronal structures TRACE loop arcade Convergent flow Differential rotation Neutral line + coronal hole
Solar and Heliospheric Observatory (SOHO) and Solar TErrestrial RElations Observatory (STEREO) spacecraft
Full-disk SOHO MDI magnetogram (left) and STEREO EUVI image (right) showing the studied quiet solar region.
The first (top) and the last (bottom) images in the studied conjugate sets of SOHO MDI and STEREO EUVI observations (left and right columns, correspondingly).
Probability distributions of MDI magnetic fluxes (top) and EUVI emission fluxes (bottom) describing the entire observational interval. Solid, dotted, dashed and dot-dashed vertical lines show respectively the percentile levels p =95.0, 97.0, 99.0, and 99.5 % used to detect intermittent events in each data set.
Spatiotemporal plots showing about 1/4 of the photospheric (MDI) and coronal (EUVI) events detected at respectively p = 99% and 95% percentile levels.
Definitions of measured parameters Scaling model
Percentile thresholds used to detect intermittent events in SOHO MDI and STEREO EUVI image sets (n - number of detected events).
Scatterplots of photospheric (left) and coronal events (right) detected at the 95% percentile threshold
Probability distributions of the photospheric magnetic events (left) and the coronal emission events (right) detected respectively from SOHO MDI and STEREO EUVI images at four different percentile thresholds
Scaling exponents of the detected photospheric and coronal events, as a function of the percentile threshold
Comparison of probability distributions of photospheric and coronal events obtained for two combinations of thresholds yielding comparable numbers of detected events in each data sets.
Normal Poynting flux of energy through the base of the corona (ideal magnetohydrodynamic approximation) The flux of free magnetic energy into the corona (Welsch 2006): The free magnetic energy W produced by a shuffling event:
Average values of scaling exponents obtained by combining p = 99% and 99.5% data for the photospheric events, p = 95% and 97% data for the coronal events.
Schematic illustration of the characteristic spatiotemporal geometry of magnetic and emission events consistent with the conducted scaling analysis.
Temporal evolution of power-law probability distribution exponents of MDI and EUVI events computed within a 90-minute moving window.
Energy budget (photosphere) Energy dissipation (corona)