Download
1 / 41
410 likes | 670 Views
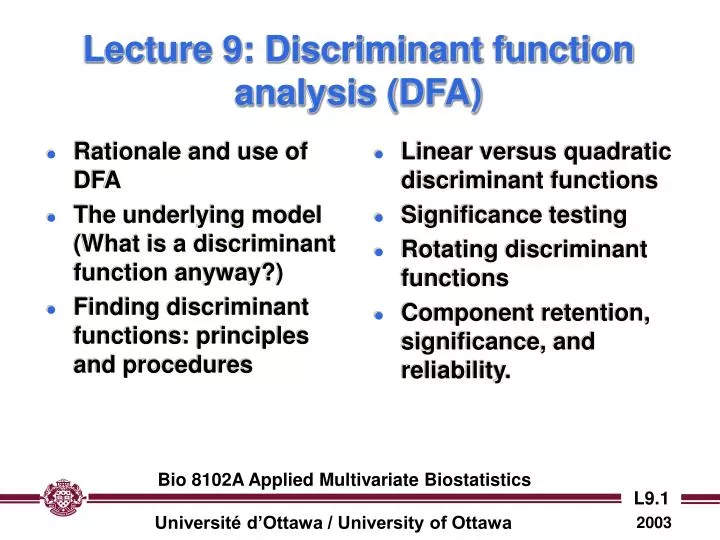
Rationale and use of DFA The underlying model (What is a discriminant function anyway?) Finding discriminant functions: principles and procedures. Linear versus quadratic discriminant functions Significance testing Rotating discriminant functions

E N D
Rationale and use of DFA The underlying model (What is a discriminant function anyway?) Finding discriminant functions: principles and procedures Linear versus quadratic discriminant functions Significance testing Rotating discriminant functions Component retention, significance, and reliability. Lecture 9: Discriminant function analysis (DFA) Bio 8102A Applied Multivariate Biostatistics
Given a set of p variables X1, X2,…, Xp, and a set of N objects belonging to m known groups (classes) G1, G2,…, Gm , we try and construct a set of functions Z1, Z2,…, Zmin{m-1,p} that allow us to classify each object correctly. The hope (sometimes faint) is that “good” classification results (i.e., low misclassification rate, high reliability) will be obtained through a relatively small set of simple functions. What is discriminant function analysis? Bio 8102A Applied Multivariate Biostatistics
Group 1 Group 2 What is a discriminant function anyway? • A discriminant function is a function: which maximizes the “separation” between the groups under consideration, or (more technically) maximizes the ratio of between group/within group variation. Frequency (not so good) Group 1 Group 2 (better) Bio 8102A Applied Multivariate Biostatistics
For a set of p variables X1, X2,…, Xp, the general model is where the Xjs are the original variables and the aijs are the discriminant function coefficients. Note: unlike in PCA and FA, the discriminant functions are based on the raw (unstandardized) variables, since the resulting classifications are unaffected by scale. For p variables and m groups, the maximum number of DFs is min{p, m-1}. The linear discriminant model Bio 8102A Applied Multivariate Biostatistics
2 groups with measurements of two variables (X1 and X2) on each object. In this case, the linear DF Z* results in no misclassifications, whereas another possible DF (Z) gives two misclassifications. The geometry of a single linear discriminant function Misclassified under Z but not under Z* X1 Z Z* X2 Group 1 Group 2 Bio 8102A Applied Multivariate Biostatistics
Finding discriminant functions: principles Z1 F(Z) • The first discriminant function is that which maximizes the differences between groups compared to the differences within groups… • …which is equivalent to maximizing F in a one-way ANOVA. a = (a1,…, ap) Bio 8102A Applied Multivariate Biostatistics
Finding discriminant functions: principles Z2 F(Z) • The second discriminant function is that which maximizes the differences between groups compared to the differences within groups unaccounted for by Z1... • …which is equivalent to maximizing F in a one-way ANOVA given the constraint that Z1, Z2are uncorrelated. a = (a1,…, ap) Bio 8102A Applied Multivariate Biostatistics
2 groups with measurements of two variables (X1 and X2) on each individual. Using only Z1, 4 objects are misclassified, whereas using both Z1 and Z2, only one object is misclassified. Group 1 Group 2 The geometry of several linear discriminant functions X1 Z2 Z1 X2 Misclassified using only Z1 Misclassified using both Z1 and Z2 Bio 8102A Applied Multivariate Biostatistics
The total (T) SSCP matrix (based on p variables X1, X2,…, Xp ) in a sample of objects belonging to m groups G1, G2,…, Gm with sizes n1, n2,…, nm can be partitioned into within-groups (W) and between-groups (B) SSCP matrices: Value of variable Xk for ith observation in group j SSCP matrices: within, between, and total Mean of variable Xk for group j Overall mean of variable Xk Element in row r and column c of total (T, t) and within (W, w) SSCP Bio 8102A Applied Multivariate Biostatistics
Calculate total (T), within (W) and between (W) SSCPs. Determine eigenvalues and eigenvectors of the product W-1 B. li is ratio of between to within SSs for the ith discriminant function Zi… …and the elements of the corresponding eigenvectors are the discriminant function coefficients. Finding discriminant functions: analytic procedures Bio 8102A Applied Multivariate Biostatistics
Equality of within-group covariance matrices (C1 = C2 = ...) implies that each element of C1 is equal to the corresponding element in C2 , etc. Covariance Variance G1 Assumptions G2 Bio 8102A Applied Multivariate Biostatistics
For a set of p variables X1, X2,…, Xp, the general quadratic model is where the Xjs are the original variables and the aijs are the linear coefficients and the bijs are the 2nd order coefficients. Because the quadratic model involves many more parameters, sample sizes must be considerably larger to get reasonably stable estimates of coefficients. Group 1 Group 2 Quadratic Z1 The quadratic discriminant model X1 Linear Z1 X2 Bio 8102A Applied Multivariate Biostatistics
Fitting discriminant function models: the problems • Goal: find the “best” model, given the available data • Problem 1: what is “best”? • Problem 2: even if “best” is defined, by what method do we find it? • Possibilities: • If there are m variables, we might compute DFs using all possible subsets (2m -1) of variables models and choose the best one • use some procedure for winnowing down the set of possible models. Bio 8102A Applied Multivariate Biostatistics
Discriminating ability: better models are better able to distinguish among groups Implication: better models will have lower misclassification rates. N.B. Raw misclassification rates can be very misleading. Parsimony: a discriminant model which includes fewer variables is better than one with more variables. Implication: if the elimination/addition of a variable does not significantly increase/decrease the misclassification rate, it may not be very useful. Criteria for choosing the “best” discriminant model Bio 8102A Applied Multivariate Biostatistics
Model stability: better models have coefficients that are stable as judged through cross-validation. Procedure: Judge stability through cross-validation (jackknifing, bootstrapping). NB.1. In general, linear discriminant functions will be more stable than quadratic functions, especially if the sample is small. NB.2. If the sample is small, then ”outliers” may dramatically decrease model stability. Criteria for choosing the “best” discriminant model (cont’d) Bio 8102A Applied Multivariate Biostatistics
Fitting discriminant function models: the problems • Goal: find the “best” model, given the available data • Problem 1: what is “best”? • Problem 2: even if “best” is defined, by what method do we find it? • Possibilities: • If there are m variables, we might compute DFs using all possible subsets (2m -1) of variables models and choose the best one • use some procedure for winnowing down the set of possible models. Bio 8102A Applied Multivariate Biostatistics
Analytic procedures: general approach Model A (Xi in) • Evaluate significance of a variable (Xi) in DF by computing the difference in group resolution between two models, one with the variable included, the other with it excluded. • Evaluate change in discriminating ability (D DA) associated with inclusion of the variable in question • Unfortunately, change in discriminating ability may depend on what other variables are in model! D DA Model B (Xi out) Retain Xi (D large) Delete Xi (D small) Bio 8102A Applied Multivariate Biostatistics
{X1} {X2,X3} {X2} {X3} {X1,X3} Strategy I: computing all possible models • compute all possible models and choose the “best” one. • Impractical unless number of variables is relatively small. {X1, X2, X3} {X1,X2} {X1,X2,X3} Bio 8102A Applied Multivariate Biostatistics
Strategy II: forward selection (X1, X2, X3,X4 ) All variables F2 > F1, F3, F4 F2 > F to enter (< p to enter) (X2) • start with variable for which differences among group means are the largest (largest F-value) • add others one at a time based on Fto enter (p to enter) until no further significant increase in discriminating ability is achieved. • problem: if Xj is included, it stays in even if it contributes little to discriminating abilityonce other variables are included. F1 > F3 , F4 F1 > F to enter (< p to enter) (X1, X2) F4> F3;F4< F to enter (> p to enter) (X1, X2) Final model Bio 8102A Applied Multivariate Biostatistics
When no variables are in the model, F to enter is the F-value from a univariate one-way ANOVA comparing group means with respect to the variable in question, and p to enter is the Type I probability associated with the null that all group means are equal. When other variables are in the model, F to enter corresponds to the F-value for an ANCOVA comparing group means with respect to the variable in question, where the covariates are the variables already entered. What is F to enter/remove (p to enter/remove) anyway? Bio 8102A Applied Multivariate Biostatistics
Strategy III: backward selection (X1, X2, X3,X4 ) All variables in F2 < F1, F3, F4 F2 < F to remove (> p to remove) (X1, X3,X4 ) • Start with all variables and drop that for which differences among group means are the smallest (smallest F-value) • Delete others one at a time based on Fto remove (p to remove) until further removal results in a significant reduction in the ability to discriminate groups. • problem: if Xj is excluded, it stays out even if it contributes substantially to discriminating abilityonce other variables are excluded. F1 < F3 , F4 F1 < F to remove (> p to remove) (X3, X4) F4< F3;F4 > F to remove (< p to remove) (X3, X4) Final model Bio 8102A Applied Multivariate Biostatistics
Canonical scores • Because discriminant functions are functions, we can “plug in” the values for each variable for each observation, and calculate a canonical score for each observation and each discriminant function. Bio 8102A Applied Multivariate Biostatistics
Canonical scores of group means 1 2 1 7.608 0.215 2 -1.825 -0.728 3 -5.783 0.513 Canonical scores plots • Plots of canonical scores for each object. • The better the model, the greater the separation between clouds of points representing individual groups, e.g. Fisher’s famous irises. 95% confidence ellipse Bio 8102A Applied Multivariate Biostatistics
In standard DFA, it is assumed that in the absence of any information, the a priori (prior) probability fi of a given object belonging to one of i = 1,…,m groups is the same for all groups: But, if each group is not equally likely, then priors should be adjusted so as to reflect this bias. E.g. in species with biased sex-ratios, males and females should have unequal priors. Priors Bio 8102A Applied Multivariate Biostatistics
For a given set of discriminant functions, misclassification rates will usually depend on the priors… …so that artificially low misclassification rates can be obtained simply by strategically adjusting the priors. So, only adjust priors if you are confident that the true frequency of each group in the population is (reasonably) accurately estimated by the group frequencies in the sample. Caveats: unequal priors Bio 8102A Applied Multivariate Biostatistics
Significance testing • Question: which discriminant functions are statistically “significant”? • For testing significance of all r DFs for m groups based on p variables, calculate Bartlett’s V and compare to c2 distribution with p(m-1) degrees of freedom Eigenvalue associated with ith discriminant function Bio 8102A Applied Multivariate Biostatistics
Significance testing (cont’d) • Each DF is tested in a hierarchical fashion by first testing significance of all DFs combined. • If all DFs combined not significant, then no DF is significant. • If all DFs combined are significant, then remove first DF and recalculate V (= V1) and test. • Continue until residual Vjno longer significant at df = (p – j)(m – j - 1) Bio 8102A Applied Multivariate Biostatistics
Caveats/assumptions: tests of significance • Tests of significance assume that within-group covariance matrices are the same for all groups, and that within groups, observations have a multivariate normal distribution • Tests of significance can be very misleading because jth discriminant function in the population may not appear as jth discriminant function in the sample due to sampling errors… • So be careful, especially if the sample is small! Bio 8102A Applied Multivariate Biostatistics
Caveats/assumptions: tests of significance • If stepwise (forward or backward) procedures are used, significance tests are biased because given enough variables, significant discriminant functions can be produced by chance alone. • In such cases, it is advisable to (1) test results with more standard analyses or (2) use randomization procedures whereby objects are randomly assigned to groups. Bio 8102A Applied Multivariate Biostatistics
Assessing classification accuracy I. Raw classification results • The derived discriminant functions are used to classify all objects in the sample, and a classification table is produced. • Classification accuracy is likely to be overestimated, since the data used to generate the DFs in the first place are themselves being classified. Misclassification (G1) = 5/48 Misclassification (G2) = 8/22 Overall misclassification = 13/70 Bio 8102A Applied Multivariate Biostatistics
Assessing classification accuracy II. Jackknifed classification • Discriminant functions are derived using N – 1 objects, and the Nth object is then classified. • This procedure is repeated for all N objects, each time leaving a different one out, and a classification table produced. • In general, jackknifed classification results are worse than raw classification results, but more reliable. Misclassification (G1) = 7/48 Misclassification (G2) = 9/22 Overall misclassification = 16/70 Bio 8102A Applied Multivariate Biostatistics
Assessing classification accuracy III. Data splitting • Use 2/3 of sample data (randomly) selected to generate discriminant functions (learning set) • Use derived discriminant functions to classified other 1/3 (test set) and produce classification table. • In general, data-splitting classification results are worse than both raw and jackknifed classification results, but more reliable. Misclassification (G1) = 8/48 Misclassification (G2) = 9/22 Overall misclassification = 17/70 Bio 8102A Applied Multivariate Biostatistics
Assessing classification accuracy IV. Bootstrapped data splitting • Use 2/3 of sample data (randomly sampled) to generate discriminant functions (learning set) • Use derived discriminant functions to classify other 1/3 (test set) and produce classification results. • Repeat a large number (e.g. 1000) times, each time sampling with replacement. • Generate classification statistics over bootstrapped samples, e.g. mean classification results, standard errors, etc. Misclassification (G1) = 14.2% Misclassification (G2) = 42.3% Overall misclassification = 23.0% Bio 8102A Applied Multivariate Biostatistics
Examine standardized coefficients (coefficients of discriminant functions based on standardized values) For interpretation, use variables with large absolute standardized coefficients. Examine the discriminant-variable correlations. For interpretation, use variables with high correlations with important discriminant functions. Interpreting discriminant functions Bio 8102A Applied Multivariate Biostatistics
Example: Fisher’s famous irises • Data: four variables (sepal length, sepal width, petal length, petal width), 3 species, N = 150 (50 for each species). • Problem: find the “best” set of DFs. Bio 8102A Applied Multivariate Biostatistics
Example: Fisher’s famous irises: between-groups F-matrix • Matrix entries are F – values from one-way MANOVA comparing group means, and can be considered measures of the distance between group centroids. • Do not use associated probabilities to determine “significance” unless you correct for multiple tests. Bio 8102A Applied Multivariate Biostatistics
Example: Fisher’s famous irises: canonical discriminant functions Canonical discriminant functions 1 2 Constant 2.105 -6.661 SEPALLEN 0.829 0.024 SEPALWID 1.534 2.165 PETALLEN -2.201 -0.932 PETALWID -2.810 2.839 • Four variables (sepal length, sepal width, petal length, petal width), 3 species, N = 150 (50 for each species). Note: discriminant functions are derived using equal priors. Bio 8102A Applied Multivariate Biostatistics
Example: Fisher’s famous irises: standardized canonical discriminant functions Standardized canonical discriminant functions 1 2 SEPALLEN 0.427 0.012 SEPALWID 0.521 0.735 PETALLEN -0.942 -0.401 PETALWID -2.810 0.581 • Four variables (sepal length, sepal width, petal length, petal width), 3 species, N = 150 (50 for each species). Note: standardized canonical discriminant functions are based on standardized values. Bio 8102A Applied Multivariate Biostatistics
Eigenvalues give amount of differences among groups captured by a a particular discriminant function, and cumulative proportion of dispersion is the corresponding proportion. • Canonical correlation is the correlation between a given canonical variate (DF) and a set of two dummy variables representing each group. Bio 8102A Applied Multivariate Biostatistics
Fisher’s irises: raw and jackknifed classification results • In this case, results are identical (a relatively rare occurrence!) Bio 8102A Applied Multivariate Biostatistics
Unless the ratio of number of objects/number of variables is large (> 20), standardized coefficients and correlations are unstable. DFA is unaffected by differences among variables in scale, so standardization is not required (unlike PCA, FA, etc.) Linear DFA is quite sensitive to the assumption of equality of covariance matrices among groups. If this assumption is violated, use quadratic classification. However, quadratic DFA is more unstable when N is small and normality does not hold. Dicriminant function analysis: caveats and notes Bio 8102A Applied Multivariate Biostatistics