Download

1 / 17
170 likes | 300 Views
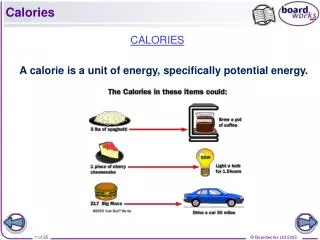
Calories Burned on a Treadmill. Matty P Andy P. Topic. We decided to pick the topic of figuring out how many calories people will burn on a treadmill while running at a specific speed for a specific distance. We studied this because Andrew loves to run.

E N D
Calories Burned on a Treadmill Matty P Andy P
Topic • We decided to pick the topic of figuring out how many calories people will burn on a treadmill while running at a specific speed for a specific distance. • We studied this because Andrew loves to run. • We found a site that would calculate how many calories were burned by the person’s weight, pace, and how long they were going. • We plugged all of our data into minitab and got a multiple regression equation. We got the equation with all the data that we plugged into the website.
Topic (cont.) • We had 24 total data points which covered both men and woman running 6,7,8, and 9 minute miles for 30, 20, and 10 minutes in length. • The average weight for men was 190lbs, the average weight for women was 162lbs. • With these values you can plug in any weight value into the equation.
Stem and Leaf Leaf Unit = 10 1 1 3 5 1 5678 8 2 014 9 2 6 11 3 02 (3) 3 579 10 4 03 8 4 589 5 5 3 4 5 6 3 6 0 2 6 5 1 7 4
Measures of Center • Mean – 368.79 • Median – 364.5 • 1Q – 209 • 3Q – 487.5 • Max – 742 • Min – 132 • Standard Deviation – 172.02
Outlier Slide • We did the IQR test to figure out if we had any outliers. • 487.5 (3Q) – 209 (1Q) = 278.5 x 1.5 = 417.75 • Upper Fence: 417.75 + 487.5 (3Q) = 905.25 • Lower Fence: 209 (1Q) – 417.75 = -208.75 • There are NO outliers.
Chebychev Slide • 95.8% of the data falls between two standard deviations of the data. • 100% of the data is within three standard deviations of the data.
Summary • We figured out a multiple regression equation. • We analyzed the data. • We found that there were no outliers. • We had a weird distribution because we compared our calories to frequency. • 100% of data falls within three standard deviations of the data. • We found that the more you weigh the more calories you burn.
Equation • Y = -76.2 + 18.4 (minutes) – 52.5 (pace) + 2.67 (weight)