Download
1 / 18
210 likes | 401 Views
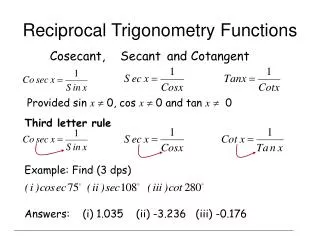
Graphing Primary and Reciprocal Trig Functions . MHF4UI Monday November 12 th , 2012. Defining a Trig Function. We have spent the last classes solving for angles with the help of the primary and reciprocal Trig Ratios. E ach trig ratio can be expressed as a function of each angle

E N D
Graphing Primary and Reciprocal Trig Functions MHF4UI Monday November 12th, 2012
Defining a Trig Function We have spent the last classes solving for angles with the help of the primary and reciprocal Trig Ratios. Each trig ratio can be expressed as a function of each angle Let’s start by examining the Trig Ratio Sine as a function of, which can be written as: or or For each inputted angle , the sine function will output the corresponding sine ratio:
Characteristics of Maximum value: 1 Minimum value: -1 Y-intercept: X-intercepts: Amplitude = 1 Period =
Amplitude and Period Amplitude is half the distance between the minimum and maximum values of the range of a periodic function A period is how often the function will complete 1 full cycle or oscillation Amplitude = 1 Period =
Graphing Sine and Cosine Functions When we graph the sine and cosine functions we can use the angle to help determine the shape of the graph. At each increment of we will have a maximum, a minimum or an x-intercept. For the cosine function: Maximums occur at Minimums occur at X-intercepts occur at
Characteristics of Maximum value: 1 Minimum value: -1 Y-intercept: X-intercepts: Amplitude = 1 Period =
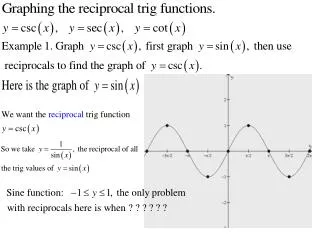
The Reciprocal Function Cosecant We know we can plot the points of the reciprocal trig function cosecant by using the sine function.
Characteristics of Maximum value: Minimum value: Y-intercept: X-intercept: Vertical Asymptotes at: Amplitude: Period =
The Reciprocal Function Secant We know we can plot the points of the reciprocal trig function cosecant by using the cosine function.
Characteristics of Maximum value: Minimum value: Y-intercept: X-intercept: Vertical Asymptotes at: Amplitude: Period =
Graphing Secant and Cosecant Functions When we graph the Secant and Cosecant functions we can use increments of to draw our graph. Each increment of will either be a Minimum or a vertical asymptote. For Sine and Cosine functions: x-intercepts vertical asymptotes on reciprocal graph Max/Min Values will be the same on the reciprocal graph
Characteristics of Maximum value: Minimum value: Y-intercept: X-intercepts: Vertical Asymptotes at: Amplitude: Period =
The Reciprocal Function Cotangent We can plot the points of the reciprocal trig function cotangent by using the tangent function.
Characteristics of Maximum value: Minimum value: Y-intercept: X-intercepts: Vertical Asymptotes at: Amplitude: Period =
Homework Questions: Complete the Primary and Reciprocal Trig Function Summary Handout Using only your calculator, graph each of the Primary and Reciprocal Trig Functions for (Do not use your summary sheet or notes)