Download
1 / 17
170 likes | 281 Views
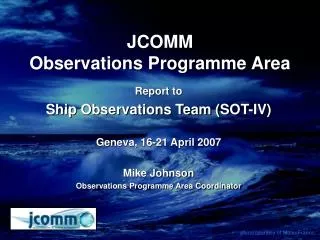
JCOMM Observations Programme Area. Report to the DBCP Angra dos Reis, 20 October 2003 Observations Programme Area Coordination Group (OCG) Mike Johnson, Chair. photo courtesy of MeteoFrance. Outline. JCOMM Observations Programme Area (OPA) International Momentum - Global Coverage

E N D
JCOMMObservations Programme Area Report to the DBCP Angra dos Reis, 20 October 2003 Observations Programme Area Coordination Group (OCG) Mike Johnson, Chair photo courtesy of MeteoFrance
Outline • JCOMM Observations Programme Area (OPA) • International Momentum - Global Coverage • Challenges for the OPA • Challenges for the DBCP
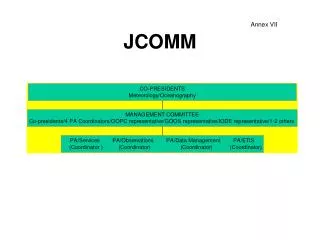
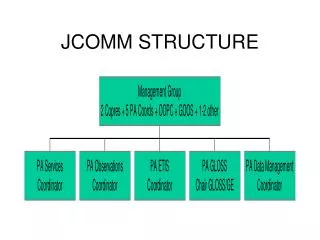
JCOMM Structure • Observations Programme Area • Services Programme Area • Data Management Programme Area • Capacity Building Programme Area
Observations Coordination Group • Chair person Mike Johnson • SOT chairperson Graeme Ball • DBCP chairperson Graeme Brough • GLOSS chairperson Christian LeProvost • Argo Science Team chairperson Dean Roemmich • TIP chairperson Michael McPhaden • Satellite expert Hiroshi Kawamura • Additional experts Paul Moersdorf Zhouwen Yu • JCOMMOPS Etienne Charpentier
Observations Coordination GroupTerms of Reference • Advise on the effectiveness, coordination, and operation of the observations programme • performance against requirements • delivery of data • standards, logistics and resources • Advice on possible solutions for newly-identified requirements • Review in situ data requirements taking in account satellite capabilities • Coordinate development of standardized practices and instrumentation • Establish expert teams, task teams, pilot projects • Examine trade-offs against requirements and resources
International Momentum • GCOS Second Adequacy Report to the UNFCCC: “The ocean networks lack global coverage * … without urgent action to address these findings, the Parties will lack the information necessary to effectively plan for and manage their response to climate change.” • Subsidiary Body for Scientific and Technological Advice (SBSTA) --”opportunity to build momentum among governments” • Earth Observation Summit • GCOS Implementation Plan * Identified for Climate -- improved Marine Services will be an immediate byproduct.
Capabilities Required • Global coverage by moored and drifting buoy arrays, profiling floats, tide gauge stations, and repeated ship lines. • Continuous satellite missions for sea surface temperature, sea surface height, surface vector wind, and ocean color • Data and assimilation subsystems • System management and product delivery
A System of Complementary Networks. Initial Design. It will Evolve. Now 40% complete. Sea Surface Temperature, Sea Surface Height, Surface Vector Wind, and Ocean Color from Space Tide Gauge Network 45 % complete 3˚x3˚ Argo Profiling Float Array 25% complete 5˚x5˚ Surface Drifting Buoy Array 35 % complete Moored Buoy Existing Planned Ocean Reference Station Existing Planned High Resolution XBT and Flux Line Existing Planned Frequently Repeated XBT Line Existing Planned Carbon Inventory & Deep Ocean Line Global Survey @ 10 years
Multi-year Phased Implementation Plan (representative milestones) 2001 2002 2000 2003 2004 2005 2006 2007 2008 2009 2010 Operational GPS/DORIS Stations 86 86 86 86 86 75 55 Tide Gauges 45 45 40 40 1250 1250 1250 1250 1250 779 810 807 671 1250 Number of buoys 1050 Surface Drifting Buoys 105 119 119 83 87 90 94 Number of moorings 79 79 77 77 Tropical Moored Buoys High resolution and frequently repeated lines occupied 41 41 41 41 36 Ships of Opportunity 30 29 26 26 24 23 3000 3000 3000 3000 3000 3000 544 200 310 Argo Floats Number of floats 2000 1000 29 29 29 10 10 24 1 7 6 2 Reference Stations Number of flux moorings 16 105 105 105 Moorings with climate sensors 60 Coastal Moorings 0 0 0 0 0 0 20 Number of flux sites/lines, One inventory per 10 years 62 62 62 48 14 14 14 14 38 Ocean Carbon Network 20 17 830 830 830 730 Dedicated Ship Time 640 Days at sea (NOAA contribution) 525 525 555 370 340 370 7 7 Product evaluation and feedback loops implemented 7 7 7 3 System Evaluation 4 0 1 1 2 Initial Ocean Observing System Milestones including international contributions 99 100 94 88 77 44 40 34 30 Total System System % Complete 53 48 2001 2002 2000 2003 2004 2005 2006 2007 2008 2009 2010
Observations Programme AreaChallenges • SOT • Integration of SOOP, VOS, ASAP • Integration of emerging CO2 program • Implement 200 VOSClim ships • Increase XBTs from 22,000 to 32,000 • GLOSS • Improve station reporting -- only 168 of 290 stations report regularly • Implement GPS at altimeter cal and long term trends subsets -- 86 stations • Argo • 25 % of 3000 in place • Maintain funding long enough to complete array and demonstrate value [common to all]
Challenges (continued) • DBCP • Increase from 800 to 1250 drifters • Extend the Tropical Moored Buoy Network across the Indian Ocean • Future integration of emerging Ocean Observatories • Observations Program Area • System monitoring and performance reporting • Funding to meet implementation targets
Need: Integrated Performance Metrics and Mapping • Standard base map • Showing required against what is in place • Gaps in coverage • Subsets by country • Single access point through JCOMMOPS
Integrated Performance Metrics and Mapping • Standard base map • Showing required against what is in place • Gaps in coverage • Subsets by country • Single access point through JCOMMOPS
Observing System Status: 2003, Q2. • Sea Surface Temperature • Performance Measure: Reduce the error in global measurement of sea surface temperature. • Metric: Estimated maximum monthly mean error in 5 regions (degrees Celsius). C 1.4 1.2 1.0 0.8 0.6 0.4 0.2 0.0 Goal: 0.3C 2003 2004 2005 2006 2007 2008 2009 2010 Year Goal: All boxes blue Drifting Buoys Moored Buoys Ships Total Goal: 100% Global Coverage
Challenge: • Deployment plan for maintaining • continuous sampling in all • 5-degree boxes.
Challenge: Future Integration of Emerging Ocean Observatories Network Sites identified by Int’l Time Series Science Team Sites identified by Int’l Time Series Science Team