Download
1 / 23
230 likes | 455 Views
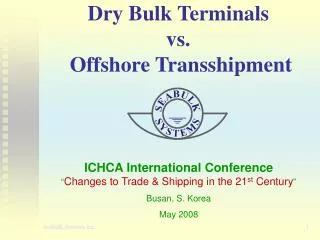
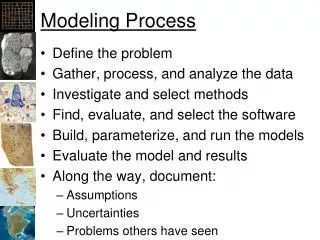
Modeling the arrival process at dry bulk terminals. Delft University of Technology. Faculty 3ME, Transport Engineering & Logistics. T.A. van Vianen, J.A. Ottjes and G. Lodewijks. Content. Arrival process Average port time Modeling arrival process Continuous quay layout or multiple berths

E N D
Modeling the arrival process at dry bulk terminals Delft University of Technology Faculty 3ME, Transport Engineering & Logistics T.A. van Vianen, J.A. Ottjes and G. Lodewijks
Content • Arrival process • Average port time • Modeling arrival process • Continuous quay layout or multiple berths • Conclusions
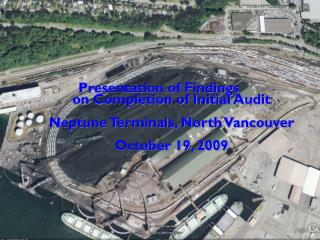
Arrival process (1) • Typical performance indicator is the average ships’ waiting time • Agreements between terminal operators and ship-owners are made about the maximum ships’ port time • Demurrage costs have to be paid if ships stay longer in the port • How much capacity must be installed at the quay side? Ship loading (Courtesy of Richards Bay Coal Terminal) Ship unloading (Courtesy of J.Hiltermann)
Arrival process (2) • How to prevent that ships are queuing before getting serviced? Find the optimum Ships waiting before servicing Costs Demurrage costs Operational costs Quay side capacity
Content • Arrival process • Average port time • Modeling arrival process • Continuous quay layout or multiple berths • Conclusions
Average port time (1) • Average port time is the average waiting time plus the average service time • Ships’ interarrival time predominately determines the average waiting time • Quay crane capacity and carriers’ tonnage determines the average service time Waiting Servicing Arrival process
Average port time (2) • Existing literature about ships’ arrivals: • Ships do not generally arrive at their scheduled times because of bad weather conditions, swells and other natural phenomena during the sea journey as well as unexpected failures or stoppages (Jagerman and Altiok, 2003) • Uncontrolled ship arrivals results in ship delays (Asperen, 2004) • Ships interarrival times best approximated by a Poisson or Erlang-2 arrival process (UNCTAD, 1985) • An Erlang-2 distribution can be used to represent the service time distribution (UNCTAD, 1985 and Jagerman and Altiok, 2003)
Average port time (3) • But what is meant with Poisson or Erlang-2 distributed interarrival times? • In a Poisson and Erlang-2 arrival process, probability distributions express the probability of a ship arrival in a fixed interval of time Poisson and Erlang-2 distributions for ships’ interarrival times with an average of 10 hours
Average port time (4) T1 ~ Erlang-2 T2 Poisson T3 ~ Normal Interarrival time distribution depends on terminal type • From 3 terminals, the arrival process was investigated to check real-world data with existing literature • T1: single-user, import terminal • T2: stevedore, import terminal • T3: single-user, export terminal Interarrival time distributions
Average port time (5) Real-world data does not correspond with the suggested Erlang-2 distribution • Service time relates directly to the carriers’ tonnage Carriers’ tonnage distributions
Content • Arrival process • Average port time • Modeling arrival process • Continuous quay layout or multiple berths • Conclusions
Modeling arrival process (1) • Modeling of the arrival process based on Queuing Theory Basic of a queuing system Labeling of queuing models • M/E2/2: • Interarrival times distributed according a Poisson (Markovian) arrival process • Service times distributed according Erlang-2 distribution • 2 servers 2 berths where each berth is equipped with 1 quay crane
Modeling arrival process (2) • For single berth queuing systems, the impact of the several interarrival times distribution was investigated Single berth queuing system M/E2/1: Average waiting time, expressed in average service time, versus quay occupancy for single berths • E2/E2/1: • D/E2/1:
Modeling arrival process (3) • Graphs of UNCTAD can be used, but what if the service time cannot be represented with an analytical distribution? • Research had shown that the unloading capacity is not constant during the entire ship unloading • For multiple berths queuing systems, there are hardly mathematical expressions Multiple berths queuing system M/M/s: E2/E2/s: ……..
Modeling arrival process (4) CraneClass.Process MyDistGen.Start(Tnow) While True do Begin If IsInQueue(CraneIdleQ) then MyDistGen.Pause While IsInQueue(CraneIdleQ) do standby; If MyDistGen.Status = interrupted then MyDistGen.Resume(Tnow); If MyShip <>nil then Begin if MyShip.Tons > 0 then Begin MyShip.Tons:=MyShip.Tons – GrabTons; Hold(Cranecycle); end; if MyShip.Tons = 0 then Begin If (IsInQueue(MyBerth.MyCranesQ)) and (MyBerth.MyCranesQ.Length > 1) then Begin LeaveQueue(MyBerth.MyCranesQ); LeaveQueue(CraneActiveQ); End; if (IsInQueue(MyBerth.MyCranesQ)) and (MyBerth.MyCranesQ.Length = 1) then Begin LeaveQueue(MyBerth.MyCranesQ); LeaveQueue(CraneActiveQ); MyBerth.MyShip.Destroy; MyBerth.LeaveQueue(BerthOccupiedQ); MyBerth.EnterQueue(DeberthQ); end; EnterQueue(CraneIdleQ); end; end; End; • A discrete-event simulation model was developed
Modeling arrival process (5) • For multiple berths queuing systems, the simulation model was used to determine the average ships’ waiting time
Modeling arrival process (6) • For multiple berths queuing systems, the simulation model was used to determine the average ships’ waiting time Multiple berths queuing system Average waiting time, expressed in average service time, versus quay occupancy for multiple berths • (M/E2/1: 1.75, M/E2/2: 0.75, M/E2/3: 0.58, M/E2/4: 0.28)
Modeling arrival process (7) • Can analytical models be used for an accurate arrival process modeling? • The simulation model was used to compare terminals’ real-world arrival data with analytical models Comparison real-world data with analytical models Table distribution to represent carriers’ tonnage for T2 * 5% of all bulk carriers were generated with tonnages between 0 tons and 25,000 tons.
Content • Arrival process • Average port time • Modeling arrival process • Continuous quay layout or multiple berths • Conclusions
Continuous quay layout or multiple berths (1) • Continuous quay layout • Multiple berths operation • Simulation input
Continuous quay layout or multiple berths (2) Occupied quay length versus annual throughput
Conclusions • Serving ships on time and at correct speed is crucial for terminal operators • Modeling the ships’ arrival process is required to design the terminal’s quay side • The ‘wilder’ the arrival pattern, the greater the average waiting time • Modeling the arrival process must be based on Queuing Theory • However, for multiple berths there are hardly analytical solutions and a discrete-event simulation is proposed • For an accurate modeling, it is proposed to use a table distribution which represents the carriers’ tonnage instead of using analytical models for the service time distribution • A continuous quay operation results in a higher annual throughput or less required quay length