Download
1 / 25
250 likes | 330 Views
Modeling Validation with NAST-M and a Cloud-Resolving Model at 50-430 GHz. R.V. Leslie, L. J. Bickmeier, W. J. Blackwell, and F. W. Chen Contributions from C. Surussavadee, P. Rosenkranz, and D. Staelin (MIT RLE); Paul Bieringer and Jonathan Hurst (MIT LL)

E N D
Modeling Validation with NAST-M and a Cloud-Resolving Model at 50-430 GHz R.V. Leslie, L. J. Bickmeier, W. J. Blackwell, and F. W. Chen Contributions from C. Surussavadee, P. Rosenkranz, and D. Staelin (MIT RLE); Paul Bieringer and Jonathan Hurst (MIT LL) 3rd International Precipitation Working Group Workshop Melbourne, Australia October 25, 2006 This work was sponsored by the National Oceanic and Atmospheric Administration under contract FA8721-05-C-0002. Opinions, interpretations, conclusions, and recommendations are those of the author and are not necessarily endorsed by the United States Government.
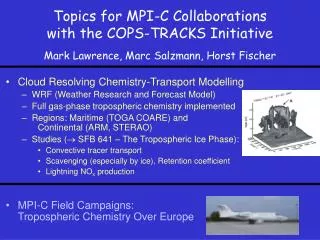
Outline • Introduction: Reconciling models & measurements • NAST-M instrument • Numerical Weather Prediction (NWP) model • Radiative transfer model & tuning • Comparison of simulated data & observations • Summary
Reconciliation of Models and Measurements • Numerical Weather Prediction (NWP) Models • Given atmospheric state at t0, predict atmospheric states at t1, t2, … • Microphysical Electromagnetic Models • Given microphysical properties of precipitation (particle size/abundance of ice, liquid, hail, graupel, etc.) calculate radiative properties (scattering and absorption of microwave radiation) • High-Resolution Microwave Radiance Measurements • NAST-M aircraft instrument • Goal: Optimization of the radiative transfer model through aircraft validation Observations NWP Modeling Radiative Transfer
NPOESS Aircraft Sounding Testbed - Microwave (NAST-M) 54 183 425 118 • Cruising altitude: ~17-20 km • Cross-track scanning • Scan angle: -65º to 65º • Swath width of ~100 km • 7.5º antenna beam width (FWHM) • 2.5 km nadir footprint diameter Developed by MIT RLE
Atmospheric Opacity at Microwave and Millimeter–Wave Frequencies • Four Spectrometers • 24 Oxygen Channels • 6 Water Vapor Channels • Millimeter-wave Propagation Model • Standard Atmosphere O2 O2 H2O O2
Mesoscale and Cloud Models • Why use mesoscale models? • Explicit forecasts of cloud and precipitation hydrometeors • Clouds • Convective storms • Detailed initial condition specification • Terrain • Land-use • Meteorological observations • Approach • Detailed storm simulations • Validate with surface radar observations • Apply satellite radiative transfer algorithms
Mesoscale Model v5 (MM5)Parameterizations • 1 km horizontal resolution • 32 vertical levels (surface to 100 mb) • 15 minute resolution output • Lower/lateral boundary conditions from Rapid Update Cycle (RUC-20 km) • Explicit microphysics (Reisner2 - six phases) • Boundary layer physics (MRF) • Radiation scheme (IR SW+LW cloud interactions) • Cold starts (~ 2-5 hours before target time)
Radiative Transfer Models • Atmospheric absorption and scattering: TBSCAT • P. Rosenkranz, “Radiative Transfer Solution using Initial Values in a Scattering and Absorbing Atmosphere with Reflective Surface,” IEEE Transactions on Geoscience and Remote Sensing, 40(8):1889-1892, Aug. 2002 • Surface emissivity: • Water - fastem • S. English & T. Hewison, “A fast generic millimetre-wave emissivity model,” In Proceedings of SPIE, Vol. 3503, 1998 • Land - Used randomly chosen values based on measurements from: • F. Weng, et al., “A microwave land emissivity model,” J. of Geophysical Research, Vol. 106, No. D17, Sept. 2001
Radiative Transfer / NWP Interface Issues Marshall-Palmer Mass Density [g/m3] Sekhon-Srivastava US Standard 1976 100 mb Radius [mm] MM5 snow graupel Each level requires hydrometeor density per drop radius Pressure [mb] rain Mass Density [g/m3]
Histograms of Simulated and Observed Brightness Temperatures (MIT RLE) AMSU-A channel 5 (53.60 GHz) AMSU-B channel 5 (183.31±7 GHz) Histograms of MM5-simulated and AMSU-observed brightness temperatures for twenty-four storms at 15-km resolution (~3000 km square) Surussavadee & Staelin July 2005 AMSU = Advanced Microwave Sounding Unit (space-based)
Electromagnetic Modeling of Precipitation Example: Frequency Dependence of Particle Type Sphere Column Plate Fitting for snow F(l) Fitting for graupel F(l) Rosette Ice habits studied (DDSCAT) Surussavadee & Staelin July 2005 F() is “ice factor” (normalized density)
Reflectivity Comparison for 11Jul02 Simulated reflectivity using MM5 output Composite radar reflectivity over a GOES visible image
50.3-GHz TB Image Comparison • Histograms of the images above are on the next slide Brightness Temperature [Kelvin] Simulated (MM5) Actual (NAST-M)
50.3-GHz Histogram Comparison Simulated Data (MM5) Actual Data (NAST-M) Simulations (Precipitation only) Brightness Temperature [Kelvin]
118.75 +/- 3.5-GHz TB Image Comparison • Histograms of the images above are on the next slide Brightness Temperature [Kelvin] Simulated (MM5) Actual (NAST-M)
118.75 +/- 3.5-GHz Histogram Comparison Simulated Data (MM5) Actual Data (NAST-M) Simulations (Precipitation only) Brightness Temperature [Kelvin]
183.31 +/- 10-GHz TB Image Comparison • Histograms of the images above are on the next slide Brightness Temperature [Kelvin] Simulated (MM5) Actual (NAST-M)
183.31 +/- 10-GHz Histogram Comparison Simulated Data (MM5) Actual Data (NAST-M) Simulations (Precipitation only) Brightness Temperature [Kelvin]
424.76 +/- 2.15-GHz TB Image Comparison • Histograms of the images above are on the next slide Brightness Temperature [Kelvin] Simulated (MM5) Actual (NAST-M)
424.76 +/- 2.15-GHz Histogram Comparison Simulated Data (MM5) Actual Data (NAST-M) Simulations w/ precipitation Brightness Temperature [Kelvin]
Final Thoughts • Numerical atmospheric and radiative transfer modeling capabilities are rapidly expanding. • Resources needed to further improve and validate these models are becoming available on a wide scale: • Computational capacity • Global, high-resolution microwave and millimeter-wave observations • New statistical characterizations of model performance can be used to “calibrate” model-generated ground-truth data for retrieval simulations, etc. • Towards all-weather radiance assimilation: • Improved reconciliation of modeled and measured radiances is vital • Study of spectral/spatial/temporal system requirements
Simulations from 11Jul02 Simulated (MM5) Actual (NAST-M) 50.3-GHz (50.21-50.39) Brightness Temperature [Kelvin] 118-GHz (118.75 +/- 3.5)
Simulations from 11Jul02 Simulated (MM5) Actual (NAST-M) 183-GHz (183.31 +/- 10) Brightness Temperature [Kelvin] 425-GHz (424.76 +/- 2.15)