Download

1 / 45
450 likes | 735 Views
Decision support system. Purpose. Proces s of decision-making using data need for rapid reaction ! Problem >>> lack of major economic data in real time

E N D
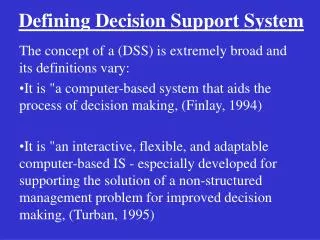
Purpose • Process of decision-making using data need for rapid reaction! • Problem >>> lack of major economic data in real time • Key information>>>available only at lower frequencies (monthly) and released with certain delay, which hinders accurate estimation of the economy position • GDP – available in quarterly dynamics, t+60 indicator
What can be done? Early warning system ESI Forecasts Nowcasting of the currentquarter Indicator of monthly GDP trend MIP Seasonal adjustmentandtrend estimation
Why the Decision Support System? • SORS, as the main producer of official statistics publishes an enormous number of data and indicators • Modern society uses the data to measure its performances and adaptation of future decisions • However, the system of official statistics isenormous, general and designed from the aspect of specific sub-sectoral needs – agriculture, trade, transport, etc. • In practice, this leads often to problems: confusion among the users, priorities not recognized, creation of contradictory perception, etc.
What is the Decision Support System? • Interactive, flexible and adaptable system, which analyses the data from different sources, presents them in an understandable and simple way in view of facilitating the system of information, learning and decision-making • Extractskey information from a large number of data, defines key indicators, augmenting the efficiency and reliability of the decision-making process • The purpose of the System is to findrelevant, but often hidden or unnoticeable relations • In this way, the statistical system becomesactive, unlike the traditional, passive approach for the processing of a large number of data DECISION 2 1 3 ALTERNATIVES Decision Support System DATA
1. System of updating projections • Projections– indicate what would be the level of an aggregate in the future, provided that a set of defined assumptions is realised • In the scope of the Decision Support System, the projection system has two aspects: PRODUCTIONSIDE OF GDP
1. System of updating projections, continued Discrepancies, between plan and statistical projections,occur when ministries and other planned subjects observe theeffects of certain measureson the GVA, or due to the difference in the expressed factography (e.g. monitoring construction by SORS and ministries) >> see annex 3 • Where the discrepancies are very pronounced, the causes thereof should be thoroughly examined • >> see annexes 4 and 5 • By getting more distant from the begginning of the year, projections should be harmonisedkcije moraju biti
1. System of updating projections, continued • Based on the trends of corresponding indicators, GDP estimations are done, being regularly updated with the most recent data • >> see annexes 1 and 2 Different GDP values (plan projections by ministries vs SORS statistical projections)
2. Seasonal adjustment and trend estimation • Seasonal adjustment is a statistical technique to remove seasonal and other calendar effects from time series, facilitating this way the observation of trends and other non-seasonal trends • It is the main analytical instrument to update projections and analyze current trends • A series or original data() composed of three complementary parts: • seasonal components ()cause changes within a year, which occur approximately at the same time and have approximately the same magnitude • trend components ()represent the disturbances in a series by one-off effects • irregular components ()long-term component from which irregular and seasonal distortions are removed, gives a more complete picture of the fundamental movement of a series • When selecting indicators that will be used in analysis (original, seasonally adjusted or trend), attention should be paid to the nature of the observed series and purpose of the analysis performed.
2. Seasonal adjustment and trend estimation, continued • Seasonally adjusted values>> are used to compare successive periods and to estimate potential values of a series when calendar effects and seasons do not exist • Original data>> are the most convenient when it is necessary to observe the actual level of activity in a domain (e.g. employment, value of constructional works performed, prices) • The best indicator of long-term and essential qualities of a series is thetrend • Trend removes the noises from a seasonally adjusted series, thus represents the most important source of information about the future movements and long-term behavior of an occurence • Filtered and free from various distortions, the trend facilitates the interpretation and understanding of an occurrence, but it gets a sense and becomes an important analytical tool only with the original and seasonally adjusted index
3. Forecasts of major macroeconomic domains • Forecasts– anticipation of macroeconomic variables at a time before the period of interest has begun • They are based on current and previous values of an occurrence, as well as on the expected future trend • With ARIMA model for time series analysis, the following divisions are forecast for three months in advance: • Industrial production – total • Manufacturing • Consumer prices • Retail trade turnover (constant and current prices) • Exports/imports
3. Forecasts of major macroeconomic domains • Example of the evaluation of a forecasting model for industry
4. Nowcastingof quartelry GDP • Nowcasting is the evaluation of a macroeconomic variable obtained during a reference period (in this case – a quarter) • The idea of nowcasting is to use thesignalsof the movement of the targeted variable based on a heterogenous set of high-frequency information • Statistical methods used for the calculation of nowcasting must not necessarily be the same as the ones used in the official calculation process >>> their goal is to provide the most reliable evaluation of the referent variable • SORSuses MIDAS: Mixed DAta Sampling as methodological frame • MIDAS regression model explains low-frequency variables as the function of high-frequency variables
4. Nowcastingof quarterly GDP, continued • GDP – actual values andnowcasting
5. Flash estimate of quarterly GDP • Flash estimate– estimate of a macroeconomic variableimmediately after the end of the reference period, based on an uncomplete set of information • Flash estimate is calculated by using mathematical and statistical methods, based on a set of indicators that are availabe at a certain point in time • The set of indicators used for the flash estimate is narrower than that used for final estimates • The flash estimate has been published in SORS since 2010, as the official data • It is available 30 days following the reference period in the form of press release
6. Indicator of the monthly GDP trend (MK30) • Indicates the monthly trend of the total economic activity of the national economy • It is obtained as the weighted average of corresponding monthly indicators: industrial production, construction, wholesale and retail trade turnover, deposits and loans, telecommunication services, number of employees and agricultural production • MK30 is harmonized with the quarterly GDP trend using the benchmarking procedure, which preserves the monthly dynamics of the economic activity with the constraints imposed by the data on quarterly GDP • The share of the mentioned activities and division in GDP are used as weights Quarterly GDP, growth rates, % МК30 index
7a. Analysis of the trends of major GDP components • With a share of 21% in GDP, industry occupies a very important place in the economy of Serbia • Purpose of the analysis: estimate of current evolution of an occurrence and its components – trend-cycle and seasonally adjusted indices – based on which conclusions can be drawn about future short-term trends • The analysis follows the trends in the sections: • B –Mining and quarrying • C – Manufacturing • D – Electricity supply... • The focus is on the divisions that have the largest share in the formation of the index of industrial production: • - Manufacture of food products • - Manufacture of manufactured metals • - Manufacture of electrical equipment • - Manufacture of chemicals • - Manufacture of pharmaceutical products
7b. Analysis of contruction • Two indicators are observed: • 1 – the value of constructional works performed • 2 – Hours of work at building sites • Quarterly activity on buildings and other constructions is monitored in detail, as well as is the number of issued building permits, at regional level
7c. Analysis of tourism • The role of tourism in the macroeconomy – impact on other economic activities and measures of the macroeconomic policy – regional development policy, development of rural areas, sustainability and competitiveness, social policy and inclusion, etc. • The analysis monitors the evolution of tourism and the effects of Government measures • Indicators: • Overnights and arrivals • Occupancy rate of permanent bed places • Tourist resorts most frequently visited Evolucija noćenja i dolazaka turista u periodu 2006-2015:
7d. Analysis of exports • At monthly frequency,two analytical documents are produced: • Detection of the changes in exports(by activities, groups of products and exporters) for certain CA 2010 divisions Example: the analysis of the changes in exports in July 2017, where the Manufacture of motor vehicles and trailerswas set aside as one of the divisions recording fall in relation to the previous month, and the same month of the previous year
7d. Analysis of exports, continued Growth/fall of exports to the same period of the previous year • Analysis of exports, by CA 2010, in Euros Green bars are for sections of CA 2010 Each section has its share in the total exports • Analysis of the trends by sections and the most important divisions • Beside the actual indices, the trend-cycle and seasonally adjusted components are also observed
8. ESI – Economic sentiment index • Economic Sentiment Indicator – ESI is a composite indicator which is intended to present the attitudes of manufacturers and consumers towards economic trends and economic stability. • It is used to estimate the economic situation, short-term forecasts and for scientific and analytical purposes • It is obtained on the basis of five different surveys which, via certain economic sections and population consumption, provides reliable indications about economic trends: - manufacturing - services - retail trade - construction - population consumption
9. MIP – Macroeconomic Imbalances Procedures • MacroeconomicImbalancesProcedure–warning mechanismaims to identify potential macroeconomic risks in their early phase, prevent the emergence of serious macroeconomic imbalances and to address the existing imbalances • It is a system for monitoring economic measures and detecting potential harmful effects that could affect adversely the functioning of the economy • 14 indicators of the situation and trendsshould indicate short-term imbalances and deteriorations, as well as accumulated long-term imbalances >> see annex 6
9. MIP – Macroeconomic Imbalance Procedure, continued • MIP indicators cover: 1. Indicators of internal imbalance– indebtedness, real estate prices, unemployment 2. Indicators ofexternal imbalances and competitiveness– current accounts, REER changes, share of exports and nominal labour costs 3. Indicators ofemployment– activity, long-term and unemployment of the youth • Imbalance – „...any trend giving rise to adverse effect on macroeconomic developments or adversely affect the correct functioning of the economy...“ (Regulation (EU) No 1176/2011 of the European Parliament and of the Council) • >> a balloon on the real estate market, banking crisis, competitiveness fall, etc.
10. Informaion on macroeconomic trends in the Republic of Serbia • Combination of visual and numerical presentation with brief explanations of an occurrence and estimate of the developments of the occurence • First page: trends in relevant divisions – industry, domestic trade, earnings, international trade in goods • Then:GDP movements, forecasts, labour market, earnings, business climate, prices, monetary movements, construction, public finances, tourism, etc.
10. Information on macroeconomic trends in the Republic of Serbia, continued - examples
11. Indicators of the external macroeconomic position of Serbia, projections 2017-2026 • Level and dynamics of external debts represent one of the in-depth macroeconomic challenges faced by holders of economic policies • The policy of indebtedness is part of the macroeconomic policy, it cannot be efficient if the global macroeconomic policy is inefficient. • The sustainability of the external debtare tightly correlated with the selectedgrowth model
11. Indicators of the external macroeconomic position of Serbia, projections 2017-2026, continued • SORShas developed a Model of Derivation of the Indicator of the External Position, which shows the movements of the main indicators of the external macroeconomic position of Serbia depending on the selected growth model, for the period from 2017 to 2026 • The model has been developed on the basis of a large number of inter-correlated indicators (indicators of external liquidity, solvency and economic openness), of assumptions andrisks of realising projections >> see annex 7 - scenario for the period 2017-2026 with indicators of the external position >> annex 8– GDP use (2016, 2017 and 2018)
11. Indicators of external macroeconomic position of Serbia, projections 2017-2026, continued • Target sizes and proportions being assigned: 1.Real GDP growth rate; • Target sizes in the structure of GDP use: 2. Share of the foreign exchange balance (goods and services) in GDP; 3. Share of the gross fixed capital formation in GDP; 4. Share of government consumption of GDP (collective consumption + individual consumption paid from budgetary sources, i.e. net earnings in public health and public education); • Target parameters of stability of the financial and non-financial market: 5. Consumer price index; 6. Foreign exchange rate; 7. Target share of exports (goods and services) in GDP
11. Indicators of external macroeconomic position of Serbia, projection projekcija 2017-2026, continued Control indicators are: • Index of real household consumption trend without individual consumption paid from budgetary sources; • index of real gross fixed capital formation trend; • Index of real government consumption trend. • Indicators of external macroeconomic position are derived, being: 1. Share of the balance of the current balance in GDP; 2. Share of imports of goods and services in GDP; 3. Foreign exchange reserves as equivalent in number of import months; 4. Foreign exchange reserves in millions of euros ; 5. Status of external debt in millions of euros: 6. Rate of external debt servicing (repayment of capital amount and interest rates related to exports of goods and services); 7. External debt in relation to exports of goods and services; 8. External debt in relation to GDP; 9. Share of foreign direct investments in GDP; 10. Volume of foreign trade in goods (exports + imports) in relation to GDP.
ANNEXES • Annex 1 – Requests for ministries – indicators of planning projections required for GDP projection
ANNNEXES • Annex 2 – Requests for public enterprises
ANNEXES • Annex3 – discrepancies between trend, i.e. statistical projections and planning projections
ANNEXES • Annex 4 – Ministry of Agriculture – report on measures
ANNEX • Annex 5- Report for monitoring the effects of ministries measures for GDP growth
ANNEXES • Annex 6- MIP indicators – main and auxiliary
ANNEXES • Annex 7 – Indicators of the external positions based on GDP projections
ANNEXES • Annex 8 – Use of GDP, 2016, 2017 and 2018