Download
1 / 4
40 likes | 133 Views
Name _______________________________________________ Date ________________ Graphing Practice Make the appropriate graphs and answer the questions with each one.

E N D
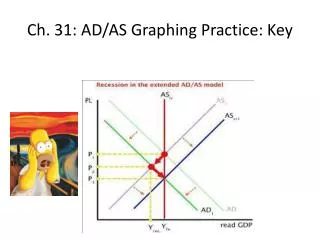
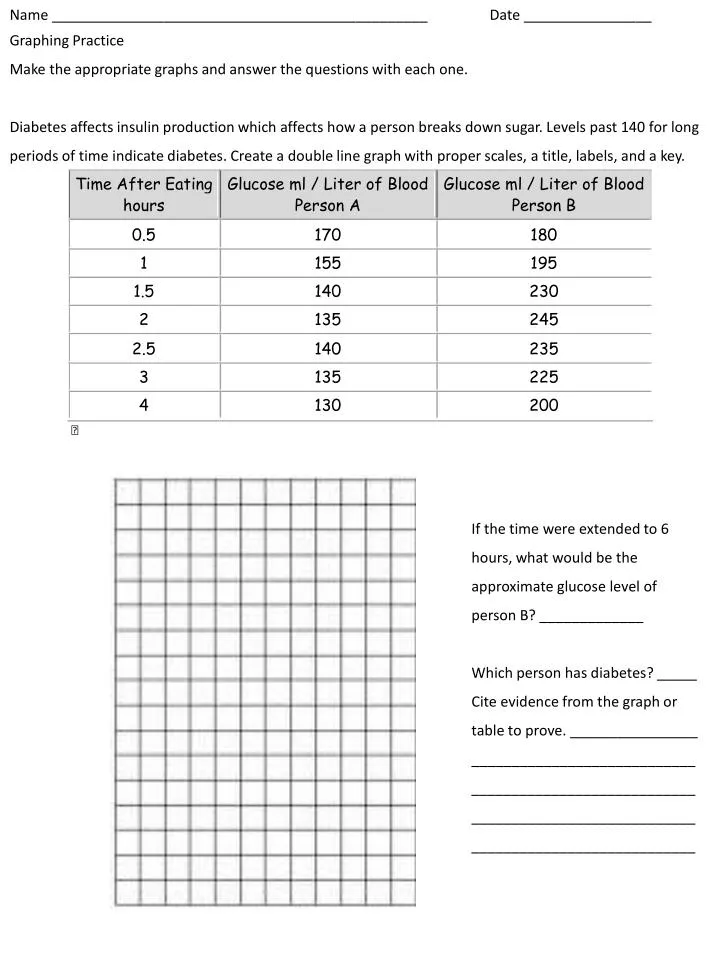
Name _______________________________________________ Date ________________ Graphing Practice Make the appropriate graphs and answer the questions with each one. Diabetes affects insulin production which affects how a person breaks down sugar. Levels past 140 for long periods of time indicate diabetes. Create a double line graph with proper scales, a title, labels, and a key. If the time were extended to 6 hours, what would be the approximate glucose level of person B?_____________ Which person has diabetes? _____ Cite evidence from the graph or table to prove. ________________ ________________________________________________________________________________________________________________
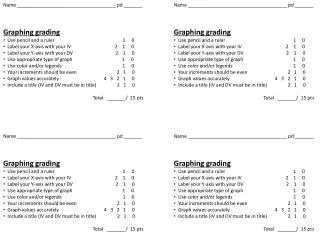
(Double bar graph) Independent variable: ____________________________ Dependent variable:____________________________ Control group: ____________________________ ____________________________ Experimental group: ____________________________ ____________________________ Does Jolt Cola work? ___________ Use evidence from the graph and table to explain why or why not. ____________________________ ____________________________ ____________________________ ____________________________
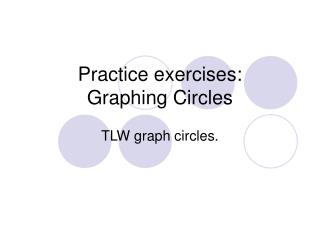
(Double line graph) Independent variable: ____________________________ Dependent variable:____________________________ Control group: ____________________________ Experimental group: ____________________________ Does muscle cream work? ______ Use evidence from the graph and table to explain why or why not. ____________________________ ____________________________ ____________________________ ____________________________