Download
1 / 19
190 likes | 336 Views
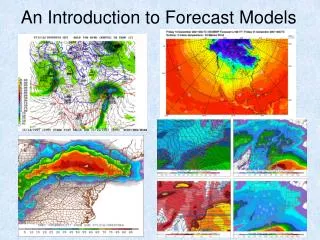
Anticipating Heavy Rainfall: Forecast Aspects. By Richard H. Grumm* National Weather Service State College PA 16803 and Robert Hart The Pennsylvania State University University Park ,PA 16804. Introduction. Data and visualization methods to facilitate identifying heavy rainfall events

E N D
Anticipating Heavy Rainfall:Forecast Aspects By Richard H. Grumm* National Weather ServiceState College PA 16803andRobert HartThe Pennsylvania State UniversityUniversity Park ,PA 16804
Introduction • Data and visualization methods to facilitate identifying heavy rainfall events • Climatological aspects • historical events • event typing • statistical analsis • Forecast aspects • apply parameters to model forecasts • apply parameters to ensemble consensus
Methoddata • Initial data : NCEP CD-ROM • Current Data (1 Jan 1948- 31 August 2000) • NCEP re-analysis data • key fields • mandatory level data • heights, temps, u and v winds • mslp • derived : thickness values from height fields • ability to display and examine key fields • real-time access to data
Methodstandardized anomalies • Intial Goal • examine monthly standardized anomalies • changed to 30-day centered anomalies • files of means and standard deviations for each parameter • GRADS • compute means and standard deviations • REGRID anomaly data to model fields and ensembles
Historical Caselook for outliers • Examined Uccellini-Kocin snowstorms • not many were historic events • most varied 2-3 Standard deviations from normal • computed top 20 anomalous events 1948-2000 • found top 10 by month • began literature search and on-line displays of cases • Junker 1993 flood cases • began typed climatologies • Paper accepted MWR August 2000 • Website: http://eyewall.met.psu.edu/
Figure 1. Reanalysis data valid 00Z 19 January 1996 showing observed fields and the standardized anomalies of a) 500 hPa heights, b) 850 hPa temperatures (oC), c) 850 hPa V-winds (kts) and d) 850 hPa dew points (oC) and specific humidity standardized anomalies. Height contours are every 6 dm, isotherms every 2 oC, winds everyt 5kts, and dew points every 4 oC. Standardized anomalies are shown by the key to the right of each panel. Heavy Rain events19 Jan historic flooding
Figure 2. As in Fig.1 except valid at 0000 UTC 13 August 2000 showing a) 500 hPa heights, b) 850 hPa isotherms, c) 850 hPa U-winds, d) 850 hPa V-winds. Heavy Rain eventsAugust 2000
Forecast Applicationsensembles • Show ensembles in traditional spaghetti plots • show ensemble consensus and standardized anomalies • view potential significant weather events • focus on key fields and key parameters • Early success Oct 99 cold outbreak and Nov 99 record plains heat
Figure 1. Twelve hour forecasts from the Eta model valid 1200 UTC 20 August 1999. Data shown include the forecast wind speed and departures of U-component and V-components in the upper and lower panels respectively. Departures represent the number of standard deviations these wind components depart from the 50-year climatological values. Short term modelsheavy rainfall examples-20 August 1999 • U-wind components • anomalous east flow • moisture off Atlantic • V-winds • strong southerly winds • Localized terrain focused heavy rainfall
Figure 2. As in Fig. 1 except for the Eta 06 hour forecast valid 1800 UTC 15 July 2000. Short term modelsheavy rainfall examples-15 July 2000 • U-wind components • anomalous east flow • moisture off Atlantic • V-winds • strong southerly winds • Banded heavy rain event
Figure 3. As in Figure 1 except Eta 12-hour forecasts valid 0000 UTC 13 August 2000. Data shown include 1000-500 (upper) and 1000-850 hPa thickness values and the standardized anomalies. Short term modelsheavy rainfall examples-12 August 2000 • Thickness anomalies • 1000-500 hPa cold • 1000-850 hPa not too cold • unstable situation • coldest anomaly in mid-levels
Figure 4. As in Fig. 1 except Eta 9-hour forecast valid 21 August 2000. Short term modelsheavy rainfall examples-12 August 2000 • Winds • no real southerly component • strong easterly component
Figure 5. As in Fig. 3 except for Eta 12-hour forecasts of 700 and 850 hPa dew points and the specific humidity departures in standard deviations from normal. Dew points contours are every 4oC. Short term modelsheavy rainfall examples-12 August 2000 • 700 and 850 hpa Q • not anomalous • long fetch over Atlantic toward terrain • Heavy record rainfalls NJ/srn NY
Conclusions • Clear signal in record events in the 52 year climatology • Easy to recreate any case • Standardized anomalies have great forecast potential • see significant events in ensembles • see significant events in Eta (shown) and AVN • need to learn key features with key parameters • Work in progress…but we learn as we share...