Download
1 / 1
10 likes | 176 Views
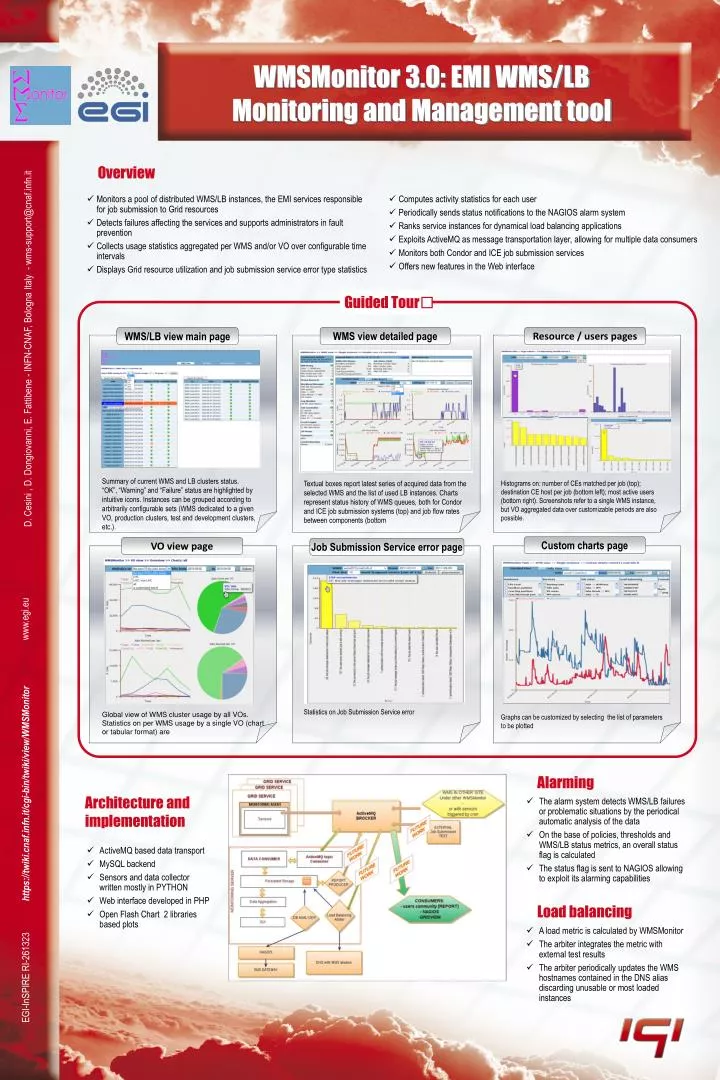
WMSMonitor 3.0: EMI WMS/LB Monitoring and Management tool. Overview. Monitors a pool of distributed WMS/LB instances, the EMI services responsible for job submission to Grid resources Detects failures affecting the services and supports administrators in fault prevention

E N D
WMSMonitor 3.0: EMI WMS/LB Monitoring and Management tool Overview • Monitors a pool of distributed WMS/LB instances, the EMI services responsible for job submission to Grid resources • Detects failures affecting the services and supports administrators in fault prevention • Collects usage statistics aggregated per WMS and/or VO over configurable time intervals • Displays Grid resource utilization and job submission service error type statistics • Computes activity statistics for each user • Periodically sends status notifications to the NAGIOS alarm system • Ranks service instances for dynamical load balancing applications • Exploits ActiveMQ as message transportation layer, allowing for multiple data consumers • Monitors both Condor and ICE job submission services • Offers new features in the Web interface Guided Tour WMS/LB view main page WMS view detailed page Resource / users pages D. Cesini , D. Dongiovanni, E. Fattibene - INFN-CNAF, Bologna Italy - wms-support@cnaf.infn.it Summary of current WMS and LB clusters status. “OK”, “Warning” and “Failure” status are highlighted by intuitive icons. Instances can be grouped according to arbitrarily configurable sets (WMS dedicated to a given VO, production clusters, test and development clusters, etc.). Textual boxes report latest series of acquired data from the selected WMS and the list of used LB instances. Charts represent status history of WMS queues, both for Condor and ICE job submission systems (top) and job flow rates between components (bottom Histograms on: number of CEs matched per job (top); destination CE host per job (bottom left); most active users (bottom right). Screenshots refer to a single WMS instance, but VO aggregated data over customizable periods are also possible. Custom charts page VO view page Job Submission Service error page www.egi.eu Statistics on Job Submission Service error Global view of WMS cluster usage by all VOs. Statistics on per WMS usage by a single VO (chart or tabular format) are Graphs can be customized by selecting the list of parameters to be plotted Alarming https://twiki.cnaf.infn.it/cgi-bin/twiki/view/WMSMonitor Architecture and implementation • The alarm system detects WMS/LB failures or problematic situations by the periodical automatic analysis of the data • On the base of policies, thresholds and WMS/LB status metrics, an overall status flag is calculated • The status flag is sent to NAGIOS allowing to exploit its alarming capabilities • ActiveMQ based data transport • MySQL backend • Sensors and data collector written mostly in PYTHON • Web interface developed in PHP • Open Flash Chart 2 libraries based plots Load balancing • A load metric is calculated by WMSMonitor • The arbiter integrates the metric with external test results • The arbiter periodically updates the WMS hostnames contained in the DNS alias discarding unusable or most loaded instances EGI-InSPIRE RI-261323