Download
1 / 30
300 likes | 384 Views
Development. www.godreamvacations.com. www.geog.okstate.edu. www.dominicanimpressions.com. What is Development?. Earth ’ s countries can be classified according to their level of development

E N D
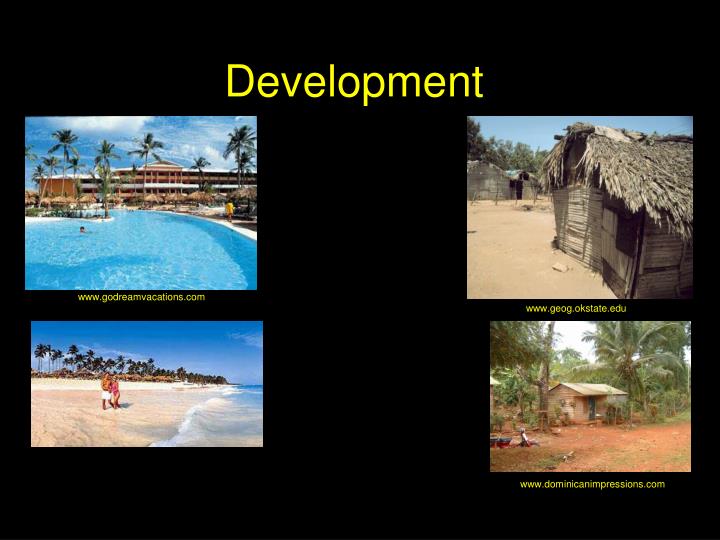
Development www.godreamvacations.com www.geog.okstate.edu www.dominicanimpressions.com
What is Development? • Earth’s countries can be classified according to their level of development • Development is the process of improving the material conditions of people through the diffusion of knowledge and technology • The process of development is continuous involving actions to improve the health and prosperity of the people • More developed countries (MDC) also known as developed or relatively developed lie further along the development continuum than less developed countries (LDC) also known as developing (implies that further progress is expected)
Challenges • For MDCs the challenge is to maintain a high level of development at a global scale • For LDCs the challenge is to find connections in the global economy by taking advantage of local skills and resources
Why Does Development Vary Among Countries? • A country’s level of development can be determined according to 3 indicators: • Economic • Social • Demographic • The UN’s Human Development Index (HDI) recognizes that a country’s level of development is a function of all 3 indicators • GDP per capita • Literacy rate and amount of education • Life expectancy • The highest HDI possible is 1.0 • Norway 0.963 • Niger 0.281
Economic Indicators of Development • UN uses Gross Domestic Product per capita • 4 other indicators are sometimes used • Economic structure • Worker productivity • Access to raw materials • Availability of consumer goods • GDP p.c. • Value of all final goods and services produced in a country in a year divided by the total population (i.e.: the average) • MDC >$20,000 p.a. • LDC ~ $1,000 p.a. • Average income does not show distribution, not informal income • E.g.: not everyone in the US is wealthy; 1/8 is classified as poor • However, the higher the GDP, the greater the potential for a more comfortable life
Economic Sectors • Jobs fall into 3 sectors • Primary – jobs involving the extraction of raw materials e.g.: farming, mining, fishing, forestry and hunting • Secondary – includes processing raw materials and manufacturing of products • Tertiary – the provision of services e.g.: banking, retailing, education, government
First priority is to secure food • A high % of agricultural workers indicates people involved in food production for themselves • A low % of agricultural workers indicates that a handful of farmers can produce all the food needed • Freed from producing food, the majority of workers can then contribute through the secondary and tertiary sectors to produce wealth
Productivity & Raw Materials • Productivity is greater in MDCs because of access to machinery and energy sources • Productivity can be measured by the value added (gross value of the product minus the cost of raw materials and energy) • Development requires access to raw materials and energy • UK, 1st developed country (C18th) had abundant raw materials; when they ran short, the imported from colonies – this sustained development in Europe but retarded it in Africa and Asia • Rise & fall in global prices for raw materials affects development • Raw materials determine development potential rather than actual development e.g.: Japan, Singapore, Switzerland (MDCs – few natural resources); DR Congo (LDC – abundant resources, unstable government)
Consumer Goods • MDC wealth pays for needs (essential for life) and wants (luxury goods & services) • 3 consumer goods (1:1 ratio in MDCs, 1:100 in LDCs) are good indicators of development • Telephones • Motor vehicles • TVs • In LDCs these goods are not central to daily life – why? • Results in different cultural characteristics
Social Indicators of Development • MDCs use their wealth to fund social services (schools, hospitals & welfare programs) • Therefore people are better educated, healthier and protected form hardships – hence they can be more productive • Countries with high levels of development have greater quality and quantity of education services • Schooling: • MDC (mean 10 years); LDC (mean 2 years) • Literacy rates (ability to read and write) • MDC (>95%); LDC (30%) • Health & Welfare • Ratios of people to doctors, hospitals & nurses (MDC low; LDC high) • Many MDCs health care is a public service (low or no cost) • Diet influences health (MDCs – more proteins & calories • MDCs welfare for sick, elderly, orphaned, vets, unemployed • Challenge of MDCs to maintain current levels of social services
Demographic Indicators of Development • Life expectancy at birth (LEB) • Others include • Infant mortality rate (IMR) • Natural increase rate (NIR) • Crude Birth Rate (CBR)
MDCs • Anglo-America (0.94) • Language & religion patterns less diverse • Wealthy, industrial, consumer, high tech, food producing • Western Europe (0.92) • More heterogeneous culturally • industrial, former colonial power, wealthy, service-centred, united (EU) • Eastern Europe (0.78) • Former Communist bloc, declining HDI, neglected modernization of industry, restructuring to market economies • Japan (0.93) • Imports raw materials, skilled labour force, R&D for new products & manufacturing processes • South Pacific (0.93) • Former British colonies; exporters of food, low populations in relation to resources
LDCs • Latin America (0.78) • Culturally diverse; urbanized, developed Atlantic coast, past political instability, uneven income distribution, landless peasants • East Asia (0.72) • China - Centrally planned, agrarian, large population, potential economic tiger, some reforms • Southeast Asia (0.71) • Large population, C20th political instability, inhospitable environments, cash crop production, corruption • Middle East (0.66) • Desert, large petroleum reserves in some states, tension between Islam & development, low literacy among women, cultural disputes, hotbed of terrorism • South Asia (0.58) • High population densities & growth, Monsoon climate, Green Revolution, low literacy amongst women • Sub-Saharan Africa (0.47) • Rich in resources, poorest region on Earth, relatively low populations compared to size of continent • In the past, resources used to fuel Europe’s economies; landlocked states trade difficulties, low world prices for resources, political instability, climatic restrictions on food supply, high NIR, corruption, tribal culture & mentality
Gender Inequality • In every country, gender inequalities exist to a greater or lesser extent • Gender-Related Development Index (GDI) • Compares level of development of women with that of both genders • Complete gender equality GDI=1.0 • Average incomes of women are less than men • Women have lower levels of literacy than men in LDCs • LEB: women higher than men (7 in MDCs; 1 in LDCs) • Gender Empowerment Measure (GEM) • Compares the ability of women and men to participate in economic and political decision making • In MDCs and LDCs fewer women hold positions of political & economic power • Fewer women in professional and technical positions
Obstacles to Development in LDCs • The gap between LDCs and MDCs continues to widen • 20% world’s population living in MDCs consumer 5/6 of world’s goods; 14% of world’s population in Africa consume 1% of world’s goods • 2 major obstacles to development • Adopting policies that successfully promote development • Finding funds to pay for development • 2 models • International trade model • Self-sufficiency model
Development Through Self-Sufficiency • Balanced growth, spreading investment equally among sectors & regions • Through trade barriers (duties, quotas, red tape) • Case Study: India • Trade barriers protected domestic industries • However India’s production was also for the domestic market only – no generation of foreign currency • Subsidies and govt run industries • Inefficient and outdated industries • Large bureaucracy prone to corruption; black market
Development Through International Trade • Use of absolute and comparative advantage to generate wealth and foreign currency • Rostow’s Development Model • Traditional society • Agrarian society, religious and military • Preconditions for take-off • Elite group initiates innovative activities; investment in new technology & infrastructure • The take-off • Rapid growth in limited activities where technology grows rapidly; other sectors remain traditional • The drive to maturity • Modern technology diffuses to all sectors; specialization of workers • The age of mass consumption • Production shifts from heavy industry to consumer goods
International Trade Model • According to the model • Each country is in 1 of the 5 stages • LDCs (1,2,3) MDCs (4,5) • LDCs will achieve development by moving up through the stages • Country engaged in international trade benefits from a wider marketplace • Must keep abreast of changes in the market • Model based on the fact that • certain countries (e.g.: Japan) had joined W. Europe & Anglo-America; surely others could too • many LDCs contain abundant raw materials
Examples of ITM • Petroleum-rich Persian Gulf States • Saudi Arabia, Kuwait, Bahrain, Oman, UAE • Used to be LDCs until 1970s oil boom • Petroleum revenues have financed large scale development – housing, airports, universities, telecom networks • Diffusion of consumer goods has altered the landscape e.g. cars, TV, imported foods • Sometimes conflicts with Islamic religious principles; sometimes adaptation occurs
Persian Gulf States http://en.wikipedia.org
Examples of ITM (cont.) • The Four Asian Dragons • S. Korea, Singapore, Taiwan & Hong Kong • Singapore & HK have no natural resources • Taiwan & S. Korea limited resources • Therefore they developed by concentrating on • Producing a handful of goods including electronic good and clothing • Lower labour costs enabling goods to be sold cheaply
Limitations of the ITM • 3 problems hinder countries from developing through the ITM approach • Uneven resource distribution e.g.: Zambia has abundant copper reserves – declining copper prices have hindered development • Market stagnation: world market demand has slowed down (MDCs have limited pop growth) • Increased dependence on MDCs: LDCs production for world markets may compromise production of necessities for the domestic market • Nevertheless the ITM has been the preferred alternative for LDCs • E.g.: India has removed trade barriers; monopolies dismantled; quality of goods has improved; attracted trans-national corporations (TNC); GDP has increased dramatically
World Trade Organization (WTO) • To promote the ITM, countries dominating world trade formed the WTO • Idea is to promote international trade • By reducing or eliminating barriers to trade • By enforcing WTO agreements & protection of intellectual property rights • Critique of WTO • WTO is anti-democratic • Protects large corporations • Compromises sovereignty of states
Financing Development • LDCs lack money for development • Funds come from MDCs • Loans from banks and international organizations • Direct investment from transnational corp. • Loans • IMF and World Bank loans to finance infrastructure projects to attract business investment and development. Problems: • Project failure • Inability of LDCs to repay loans • TNC (HQ in MDCs; branches in LDCs). Problems: • Profits return to MDCs • Employment opportunities extended to fortunate few • Negative impact on local culture
Core-Periphery Model (cont.) • Core – MDCs • W. Europe, Anglo-America, Australia & New Zealand • Periphery – LDCs • outer rings around the core • Africa, Asia, S. America, E. Europe • Semi-periphery – Newly Industrialized Countries (NIC) e.g.: Taiwan, Mexico, Brazil, India, S. Korea
The Role of NGOs & IDAs in Development • Non-governmental organizations (NGOs) • Case Studies: • World Vision • The Grameen Bank • Social Entrepreneurs • International Development Agencies (IDAs) • Case Studies • Canadian International Development Agency (CIDA) • Norwegian Aid