Download
1 / 19
190 likes | 308 Views
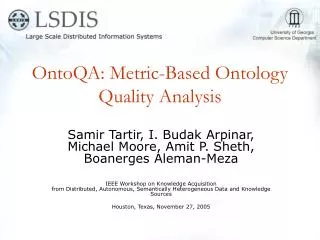
Ontology Evaluation and Ranking using OntoQA. Samir Tartir and I. Budak Arpinar Large-Scale Distributed Information Systems Lab University of Georgia. The First IEEE International Conference on Semantic Computing September 17-19, 2007 Irvine, California, USA. Outline.

E N D
Ontology Evaluation and Ranking using OntoQA Samir Tartir and I. Budak Arpinar Large-Scale Distributed Information Systems Lab University of Georgia The First IEEE International Conference on Semantic Computing September 17-19, 2007 Irvine, California, USA
Outline • Why ontology evaluation? • OntoQA • Overview • Metrics • Overall Score • Results • Future Work
Why Ontology Evaluation? • Having several ontologies to choose from, users often face the problem of selecting the ontology that is most suitable for their needs. • Ontology developers need a way to evaluate their work
OntoQA • a suite of metrics that evaluate the content of ontologies through the analysis of their schemas and instances in different aspects such as the distribution of classes on the inheritance tree of the schema, the distribution of class instances, and the connectivity between instances of different classes. • OntoQA is • tunable • requires minimal user involvement • considers both the schema and the instances of a populated ontology.
OntoQA Overview Keywords
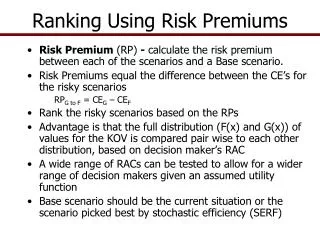
I. Schema Metrics • Address the design of the ontology schema. • Schema could be hard to evaluate: domain expert consensus, subjectivity etc. • Metrics: • Relationship diversity • Inheritance deepness
I. Schema Metrics • Relationship diversity • This measure differentiates an ontology that contains mostly inheritance relationships (≈ taxonomy) from an ontology that contains a diverse set of relationships. • Schema Deepness • This measure describes the distribution of classes across different levels of the ontology inheritance tree
II. Instance Metrics • Evaluate the placement, distribution and relationships between instance data which can indicate the effectiveness of the schema design and the amount of knowledge contained in the ontology.
II. Instance Metrics • Overall KB Metrics • This group of metrics gives an overall view on how instances are represented in the KB. • Class-Specific Metrics • This group of metrics indicates how each class defined in the ontology schema is being utilized in the KB. • Relationship-Specific Metrics • This group of metrics indicates how each relationship defined in the ontology schema is being utilized in the KB.
Overall KB Metrics • Class Utilization • Evaluates how classes defined in the schema are being utilized in the KB. • Class Instance Distribution • Evaluates how instances are spread across the classes of the schema. • Cohesion (connectedness) • Used to discover instance “islands”. CID = StdDev(Inst(Ci))
Class-Specific Metrics • Class Connectivity (centrality) • This metric evaluates the importance of a class based on the relationships of its instances with instances of other classes in the ontology. • Class Importance (popularity) • This metric evaluates the importance of a class based on the number of instances it contains compared to other classes in the ontology. • Relationship Utilization • This metric evaluates how the relationships defined for each class in the schema are being used at the instances level.
Relationship-Specific Metrics • Relationship Importance (popularity) • This metric measures the percentage of instances of a relationship with respect to the total number of relationship instances in the KB.
Ontology Score Calculation Metrici: {Relationship diversity, Schema Deepness, Class Utilization, Cohesion, Avg(Connectivity(Ci)), Avg(Importance(Ci)), Avg(Relationship Utilization(Ci)), Avg(Importance(Ri)), #Classes, #Relationships, #Instances} Wi: Set of tunable metric weights
Results Swoogle Results for "Paper"
OntoQA Ranking - 1 OntoQA Results for "Paper“ with default metric weights
OntoQA Ranking - 2 OntoQA Results for "Paper“ with metric weights biased towards larger schema size
OntoQA vs. Users Pearson’s Correlation Coefficient = 0.80
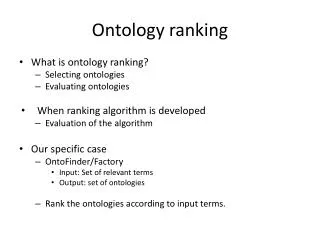
Future work • Enable the user to specify an ontology library (e.g. OBO) to limit the search in ontologies that exist in that specific library. • Use BRAHMS instead of Sesame as a data store since BRAHMS is more efficient in handling large ontologies that are common in bioinformatics.