Download
1 / 29
290 likes | 297 Views
Explore the reasons for international trade, the impact of exchange rates on prices, and the effect of trade policies on managerial decisions. Learn about comparative advantage, intra-firm trade, and increasing returns to scale.

E N D
Chapter 17 Global Business
Table of Contents • 17.1 Reasons for International Trade • 17.2 Exchange Rates • 17.3 International Trade Policies • 17.4 Multinational Enterprises • 17.5 Outsourcing
Introduction • Managerial Problem • Business is global. Wheat and Rolls Royce cars are examples of it. • How does the price of wheat or a Rolls Royce change in response to a change in exchange rates? Does the change depend on the competitiveness of the market? • Solution Approach • We need to examine why firms and countries participate in international trade, and how trade policies about taxes affects managerial decisions on investment and outsourcing. • Empirical Methods • International trade depends on comparative advantage and prices affected by exchange rates. • Trade policies include tariffs and quotas to restricts imports, and subsidies to encourage exports. • Differentials in taxes, exchange rates, and outsourcing conditions affect multinational enterprises’ investment decisions.
17.1 Reasons for International Trade • Comparative Advantage Reason • Comparative advantage: the ability to produce a good or service at lower opportunity cost than other countries • Suppose that the U.S. and Japan do not trade and each country is in competitive equilibrium (p = MC). The U.S. produces and sells a bag of rice for $1 and a silk scarf for $10 (10 rice bags = 1 scarf). Japan produces and sells a bag of rice for ¥200 and a scarf for ¥1,000 (5 rice bags= 1 scarf). The opportunity cost of scarves is lower in Japan, and the opportunity cost of rice is lower in the U.S. • Comparative Advantage and Gains from Trade • In the U.S. and Japan example, the U.S. has a comparative advantage in producing rice and Japan has a comparative advantage in producing scarves. • In the absence of transportation costs, both countries could gain if the U.S. shipped rice to Japan and Japan shipped scarves to the U.S. If the U.S. could produce 1 scarf less and increase 10 rice bags, and Japan could produce 5 rice bags less and have 1 extra scarf, both countries could produce the same number of scarves and have 5 extra bags of rice.
17.1 Reasons for International Trade • Intra-firm Trade Reason • Intra-firm trade: a single firm is on both sides of an international transaction. It exports the output from its operation in one country to an affiliated business unit in another country. About one-third of world trade is intra-firm trade. • General Electric (GE), has production facilities in many countries, including Hungary and Romania. To produce a refrigerator, GE must manufacture the basic parts and assemble those parts into a finished product. So, GE may take advantage of intra-firm trade to reduce costs and maximize profits. • Gains from Intra-firm Trade • Productivity information per day: A Hungarian worker can produce parts for 4 refrigerators or can assemble 4 refrigerators. A Romanian worker can produce parts for 2 refrigerators or can assemble 1 refrigerator. • Opportunity cost and comparative advantage: The Romanian plant has comparative advantage in assembly (lower opportunity cost) and the Hungarian plant has comparative advantage in parts. • Intra-firm trade: The Romanian plant should assemble refrigerators and the Hungarian plant should manufacture parts.
17.1 Reasons for International Trade • Increasing Returns to Scale Reason • Increasing returns to scale (IRS) production function: if all inputs are doubled, the resulting output more than doubles. Thus, all else the same, having one IRS plant produce a given amount of output is less costly than spreading the production over two IRS plants. • Gains from IRS • Production information: GE’s production function exhibits IRS, so that doubling labor triples output. GE has two plants in Hungary, each with 50 workers. Operating independently, each plant can produce 200 refrigerators. • Gains from IRS: Given IRS production function, GE may close one plant and reallocate all 100 workers in only one facility. Output will triple up to 600 units. • Gains from IRS and trade: If the Hungarian market size is small, only 400 refrigerators, GE can export the additional 200 units.
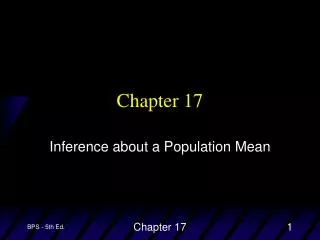
17.2 Exchange Rates • The Price of a Currency • An exchange rate is the price of one currency (such as the euro) in terms of another currency (such as the dollar). • The euro (€) is the currency of 23 European countries that belong to the Eurozone. It can be traded for U.S. dollars ($), Japanese yen (¥), British pounds (₤), or many other currencies. • Determining the Exchange Rate • Because currency is exchanged in a competitive market, we can use the familiar supply and demand model to determine the exchange rate (dollar per euro). • The demand curve slopes down because the quantity of euros demanded by Americans increases as the exchange rate falls: the euro costs fewer dollars. The supply curve of euros, S, slopes up because Europeans are willing to trade more euros as the exchange rate increases. • The intersection of the supply and demand curves determines the equilibrium. • Many factors affect the supply and demand for a particular currency, including financial and macroeconomic conditions.
17.2 Exchange Rates • Exchange Rates and the Pattern of Trade • If the exchange rate for the euro falls, U.S. consumers and firms increase their demand for European goods (more goods for a given number of dollars). Similarly, the demand of European consumers and firms for U.S. goods falls. • A change in exchange rates gives incentives to trade between countries. Goods flow from one country to the other, arbitrage, until no more profits can be made. • Managing Exchange Rate Risk • Exchange rates are determined in competitive markets, and not only aggregate economic variables influence the equilibrium, but also political factors. So individual firms that operate in many countries bare the risk that exchange rates move in unexpected directions that may negatively affect profits. • Reducing risk: a firm may transfer all risk to the other party by imposing the transaction in the firm’s own currency. • Hedging risk: a firm may buy a forward contract or a futures contract at a fixed rate. The Chicago Mercantile Exchange is the largest futures market in the U.S.
17.3 International Trade Policies • Trade Policies that Restrict Imports • Historically, governments have concentrated on restricting imports rather than limiting or encouraging exports. So, we focus on the effects of trade policies that restrict imports on prices, government revenue, and total surplus in a competitive domestic market. • Four Possible Import Trade Policies • Allow free trade: Foreign firms may sell in the importing country without restrictions. • Ban all imports: The government sets a quota of zero on imports. • Set a tariff: The government imposes a tariff on imported goods. • Set a positive quota: The government limits imports to a determined QM level. • Application to the U.S. Crude Oil Market • To compare oil import trade policies, we assume that transportation costs are zero and that the U.S. is small enough to be a price taker in world markets. • Consequently, the supply curve of oil is horizontal at the world price p*. • The U.S. can import as much crude oil as it wants at p* per unit.
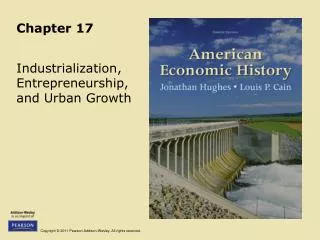
17.3 International Trade Policies • Free Trade Versus a Ban on Imports • If p* is below the domestic price, preventing imports raises the price of crude oil domestically, reduces consumer surplus, increases producer surplus, and creates deadweight loss. • So the ban on imports does not help the U.S. • Free Trade vs. Ban on Imports: Graphical Analysis • Free Trade: In Figure 17.2, the supply, S1,is horizontal at p* = $93 per barrel. The equilibrium is at e1, the U.S. daily consumption is 15 million barrels (7.7 imports). • Ban: Limiting imports to zero, the crude oil supply is the U.S. domestic supply, S2. At the new equilibrium, e2, the new price is $218 per barrel for 10.2 million barrels per day. • Deadweight loss: the ban increases PS in $1.09 billion per day but reduces CS in $1.58 billion per day. TS is reduced in $481 million per day.
17.3 International Trade Policies Figure 17.2 The Loss from Eliminating Free Trade
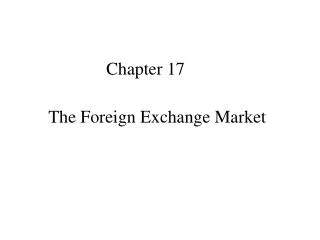
17.3 International Trade Policies • Free Trade Versus a Tariff • Two common types of tariffs are specific tariffs (tdollars per unit) and ad valorem tariffs (αpercent of the sales price). • Tariffs are applied only to imported goods. So tariffs do not raise as much tax revenue or affect equilibrium quantities as much as taxes applied to all goods. • Free Trade vs. Specific Tariff: Graphical Analysis • Free Trade: In Figure 17.3, the supply, S1,is horizontal at p* = $93 per barrel. The equilibrium is at e1, the U.S. daily consumption is 15 million barrels (7.7 imports). • t tariff of $40 per barrel: the new supply is horizontal at p = $133 and at the new equilibrium, e3, the daily consumption is 13.3 million barrels (5.2 imports). • Deadweight loss: the specific tariff increases PS in $308 million per day, reduces CS in $566 million per day and government gets $208 million per day. TS is reduced in $50 million per day, less than with a ban.
17.3 International Trade Policies Figure 17.3 Effects of a Tariff or a Quota
17.3 International Trade Policies • Free Trade Versus a Quota • The effect of a positive quota is similar to that of a tariff. • Thus, a quota on imports of 5.2 million barrels per day leads to the same equilibrium, e3 in Figure 17.3, as a tariff of $40 per barrel. • Positive Quota vs. Specific Tariff: Deadweight Loss • As it can be seen in Figure 17.3, the PS increases in $308 million per day and the CS reduces in $566 million per day either with a $40 tariff or a 5.2 million quota. • However, the government revenue of $208 million per day is only generated with a tariff. This amount is not collected with a quota, so who gets it? • If the government gives the right to sell the quota to foreign firms, they benefit from buying at $93 internationally and selling it at $133 domestically. The TS is reduced in $258 million per day, instead of $50 million per day. • If the government sells the right to sell the quota at $40 per barrel to any firm, then the deadweight loss is exactly the same. TS reduces by $50 million per day.
17.3 International Trade Policies • Why Trade Barriers? Rent Seeking • If tariffs and quotas harm the importing country, why do governments impose trade barriers? • It pays for producers to organize and lobby the government to enact these trade policies because there are large individual potential gains. On the other hand, consumers as a whole suffer large losses but the loss to any one consumer is usually small. So firms engage in rent seeking activities. • Rent Seeking in Food and Tobacco Industries • Lopez and Pagoulatos (1994) estimated the deadweight loss and the additional losses due to rent-seeking activities in the U.S. in food and tobacco products was $17.8 billion (in 2013 dollars), or 2.6% of the domestic consumption expenditure on these products. • In dairy products and sugar manufacturing, the loss to consumers was $84.8 billion, producers gained $64.4 billion and the government collected $2.2 billion. The deadweight loss was $17.8 billion.
17.3 International Trade Policies • Other Reasons for Trade Policies: Creating Market Power • A government can drive the price to a monopoly level by using tariffs or quotas, even if the underlying industry is highly competitive. • The Philippines used this policy to drive the price of coconut oil up. • Other Reasons for Trade Policies: Strategic Trade Policy • A government’s trade policy can increase the share of the profits in imperfectly competitive industries that goes to its domestic industry. • Other Reasons for Trade Policies: Contingent Protection • Contingent protection is a trade policy that protects domestic producers from certain actions by foreign firms or governments. • Many countries have contingent protection laws against dumping (a foreign producer sells a product at a price that is lower than its cost of production).
17.3 International Trade Policies • Trade Liberalization and the World Trade System • The General Agreement of Tariffs and Trade (GATT-1947) was replaced by the World Trade Organization (WTO-1995) to promote trade liberalization and limit trade policies that create distortions (tariffs and quotas to gain market power). • Only 23 nations signed the first GATT agreement in 1947. At present, over 150 countries are members of the WTO and signatories to the GATT. These countries are responsible for almost all of the world’s trade. • WTO allows members to establish preferential trading arrangements, including multilateral or bilateral free trade agreements, like NAFTA or CAFTA. • Trade Liberalization Problems • Critics of freer trade raise concerns about environmental standards and wages and labor standards. They predict developing countries may become pollution havens and manufacturing infernos. • However,the Mexican experience after entering NAFTA indicates neither a notable increase in environmental problems, nor a notable decrease. And there is no evidence of general labor standards deterioration.
17.4 Multinational Enterprises • Multinational Ownership Structure • Multinational enterprises (MNE) normally have a parent company and a number of foreign affiliates with their own CEOs. • An affiliate is a company in which the parent has at least 10% ownership. If the ownership share is 50% or more, then the affiliate is called a subsidiary. • Each subsidiary normally has discretion over business decisions such as how much to produce, what prices to charge, and how much and where to advertise. • Typically, a MNE is an interlocking network of corporations connected through ownership. • Becoming a Multinational • A firm becomes a MNE through foreign direct investment (FDI). • The two types of FDI are greenfield investments and the purchase of foreign assets.
17.4 Multinational Enterprises • International Transfer Pricing • A MNE can gain tax and other advantages by trading goods among its subsidiaries located in different countries. The key element is the transfer price: the price used for an intra-firm transfer of goods or services. • Toyota Motor Corporation (parent firm) has two subsidiaries in the U.S., Toyota Motor Engineering & Manufacturing North America (TEMA) and Toyota Motor Sales, U.S.A., Inc. (TMS). Toyota also has a subsidiary in Canada, Toyota Motor Manufacturing Canada Inc. (TMMC). • TEMA and TMMC sell cars to TMS, which in turn sells and distributes them to Toyota dealerships. The price at which TEMA sells cars to TMS is a domestic transfer price and the price at which TMMC sells cars to TMS is an international transfer price. • Transfer Pricing Using Toyota Motor Corporation • We will examine how TMMC sets its transfer price to TMS for a Toyota RAV4 Electric crossover SUV, which was jointly developed with Tesla Motors and is produced by only TMMC as of 2012. • We assume, for simplicity, that the RAV4 is a monopoly product.
17.4 Multinational Enterprises • Profit Maximizing Transfer Pricing: Vertical Integrated Case • If TMS were vertically integrated with TMMC (produce and sell cars) it would apply a monopoly markup M to its marginal cost of producing a RAV4 car, m, to obtain its profit-maximizing monopoly price, p1 = M × m. • M > 1 because a profit-maximizing monopoly sets its price above its marginal cost. • Profit Maximizing Transfer Pricing: Non-vertical Integrated Case • In reality the two Toyota subsidiaries are independent. TMMC is the monopoly supplier of the electric RAV4 to TMS, and TMS sells RAV4’s to consumers. • TMMC sells to TMS at a monopoly transfer price, p* = M* × m, where M* is TMMC’s markup and m is its marginal cost. • TMS, in turn, sets a markup M to p* (its real marginal cost) and sells a RAV4 in the U.S. market at p2 = M × p* = M × M* × m. • Given that M > 1 and M* > 1, p2 > p1. Toyota corporation (parent) does not maximize profit because charging a higher-than-monopoly price, p1, reduces the parent company’s total profit. So, Toyota parent should coordinate transfer pricing.
17.4 Multinational Enterprises • Tax Avoidance and Transfer Pricing • If corporate tax rates differ across countries, Toyota prefers to earn most of its profit in the low-tax country. The transfer price determines the allocation of profits between TMMC and TMS. • If TMMC pays a Canadian corporate income tax of 20%, while TMS pays a U.S. corporate tax rate of 30%, then Toyota prefers to earn its profits in Canada rather than in the United States. The Toyota parent prefers a high transfer price. • Toyota Transfer Pricing and Profits in Canada and the U.S. • Profit in the U.S.: Assume that TMMC’s m = p* = $30,000, so the transfer price to TMS includes zero markup and TMMC’s profits are zero. TMS applies a markup M = $2,000, then p1=$32,000, and Toyota’s profit after 30% tax is $1,400. • Profit in Canada: Assume TMMC’s markup M* = $2,000 , so the transfer price p* = $32,000. TMS applies zero markup, p1 = $32,000 and profit in the U.S. is zero. TMMC pays a 20% corporate tax, and Toyota’s profit after tax is $1,600. • Toyota (parent) prefers a high transfer price to avoid the higher U.S. tax.
17.4 Multinational Enterprises • ‘All Other Things Equal’ Condition • In the previous tax case, ‘all other things equal,’ Toyota (parent) prefers a high transfer price to avoid the higher U.S. tax. However, other things are not equal. • A tradeoff exists between the tax advantage of high transfer prices and the inefficiency of having a transfer price above marginal cost. The high transfer price induces the subsidiary to import fewer units. • As in any cost-benefit managerial decision, the profit-maximizing transfer price would be where the marginal cost and marginal benefit increases in the transfer price are just equal. • Transfer Pricing, Tax Avoidance and Tax Evasion • Tax authorities pay careful attention to transfer pricing. The general rule is that transfer prices must reflect normal pricing practices that apply in the absence of tax incentives. • Authorities distinguish tax avoidance, a legal way of reducing taxes, from tax evasion, illegal methods of reducing tax payments, such as keeping fraudulent financial records.
17.5 Outsourcing • International and Domestic Outsourcing • International outsourcing, where a firm buys goods and services from foreign suppliers that the firm would otherwise provide internally, is controversial and sometimes subject to consumer’s boycott. However, it is less controversial than domestic outsourcing. In fact, all firms outsource in some degree. • While the debate rages in the United States about jobs moving to India and other foreign countries, Europeans are protesting that high-paying R&D jobs are being outsourced to the United States from Europe (insourcing). • Free Trade and Compensation • Free trade, including outsourcing and based on comparative advantages, implies that some people gain and some people lose. Firms in noncompetitive sectors may lose sunk capital. Their workers may suffer from at least temporary unemployment. The gains in the other sectors are large enough to compensate the losers. However, if society fails to compensate them, they will be adamantly (and reasonably) opposed to free trade. • The U.S. spends only 0.5% of its GDP assisting displaced workers, compared to 0.9% in the U.K., 3.1% in Germany, and 3.7% in Denmark (Farrell, 2006).
Managerial Solution • Managerial Problem • How does the price of wheat or a Rolls Royce change in response to a change in exchange rates? Does the change depend on the competitiveness of the market? • Solution • Wheat is nearly a perfect competitive market, while a Rolls-Royce is nearly a monopoly. Consumers perceive that wheat is wheat in the sense that it is an identical standard product, but a Rolls-Royce is a Rolls-Royce in the sense that there is no close substitute. • In the competitive wheat example and in the Rolls-Royce example, the price in the exporting country remains constant in response to a change in the exchange rate. • In the wheat market, the foreign (Japanese) price adjusted fully to a change in the exchange rate. In contrast, in the non-competitive Rolls-Royce example, the foreign U.S. price only partially adjusted to a change in the exchange rate. • Therefore: Yes, the price adjustment to changes in exchange rates depends on market competitiveness.
Figure 17.1 Supply and Demand Curves Determine the Exchange Rate
Table 17.4 Drug Entry Game with a Subsidy to Ajinomoto of 10