Download

1 / 23
230 likes | 235 Views
The RAD (RNA Abundance Database) website provides the RAD3 schema, which emphasizes ontology integration and allows for detailed analysis of microarray data. Explore the website to understand the schema and its various tables. Questions and suggestions for integration with other websites are welcome.

E N D
The Website of RAD (RNA Abundance Database) Junmin Liu (lab meeting 2/20/03)
“Raddies” Greg Grant Hongxian He Junmin Liu Matt Mailman Elisabetta Manduchi Shannon McWeeney (now at OHSU) Angel Pizarro Chris Stoeckert Trish Whetzel
Outline • Overview of RAD3 schema • RAD3: Ontology emphasis • Click through the website • Conclusion • Question
RAD3 schema • Tables can be divided into six parts: Array, Assay, Biomaterial, Study Design, Data processing and misc. parts. • Reduced the views in Array and Assay parts • Suite of Biomaterial tables to cover sample treatment in great detail. • More structured Study Design tables to facilitate the cross-study microarray data comparison • Flexible Data Processing Tables to fit any analysis type • OntologyEntry----better suit the MGED efforts (MIAME, Ontology)
RAD schema uses MAGE/MIAME MAGE Experiment Array BioMaterial BioAssay BioAssayData Protocol, Descr. HigherLevelAnalysis MIAME Experimental Design Array design Samples Hybridization, Measure Normalization .
RAD3 schema • Platform Tables (7) • Assay to Quantification Tables (10) • Study Design Tables (8) • BioMaterial Tables (7) • Assay Result Tables (2) • Processing Tables (6) • Analysis Result Tables (7) • Misc Tables: Protocol, MAGE, Ontology (6) Core and SRes tables are also largely employed
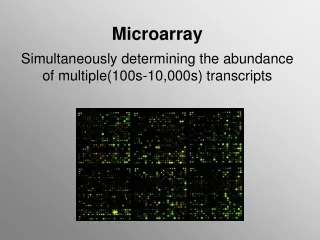
Minimal Information About a Microarray Experiment (MIAME) • Provides the concepts for the ontology • Array design description • Common features of the array as the whole, and the description of each array design elements (e.g., each spot) • Gene expression experiment description • Experimental or Study design • Samples used, extract preparation and labeling • Hybridization procedures and parameters • Measurement data and specifications of data processing • See Brazma et al Nature Genetics 2001 and http://www.mged.org/Workgroups/MIAME/miame.html
OntologyEntry • Purpose • Provide terms and details necessary to create instances of a microarray experiment • Benefits • Known terms with a defined meaning • Minimize free text in database • Web queries can be generated using CV terms
RAD::OntologyEntry Categories • Array Design • Element type • PCR • oligo • Substrate type • nylon • glass • Platform type • spotted cDNA microarray • photolithographic oligo array
RAD::OntologyEntry Categories • Study Design • Replicate • Dose response • Quality control • Normalization • Time series • Study Factor • Methodological Factor • Protocol variation • Hardware variation • Software variation • Operator variation • Biological Factor • disease state • organism part • developmental stage • genetic variation • History Factor
RAD::OntologyEntry Categories • bioMaterial Characteristics • Organism • Contact information for bioMaterial provider • Descriptors relevant to the particular sample, such as • Age • Sex • Developmental stage • Organism part (tissue) • Cell type • Animal/ plant strain or line • Genetic variation (e.g., gene knockout, transgenic variation) • Individual genetic characteristics (e.g., disease alleles, polymorphisms) • Disease state • Clinical information • The individual (for interrelation of the samples in the experiment
RAD WebsiteGeneral structure • Menu based • Home---Query---Analysis---Download---Data Submission---Publication • Written in html, php4 and perl cgi scripts • Graphics generated by GraphViz. • Ontology driven interface
Conclusions The RAD web reflects the new RAD schema as well as the well developed ontology concepts. Provide limited ways to analyze the microarray data online. A way of rewarding RAD developers and annotators as well.
Question • How to better integrate the effort of three websites: PlasmoDB, EPConDB, RAD? • A gerneral web software development architecture? • A uniform CBIL web design?
“Raddies” Greg Grant Hongxian He Junmin Liu Matt Mailman Elisabetta Manduchi Shannon McWeeney (now at OHSU) Angel Pizarro Chris Stoeckert Trish Whetzel
Study StudyDesign StudyFactor Study Design Tables StudyAssay StudyDesignDescription StudyDesignAssay Assay StudyFactorValue
BioMaterial Tables BioMaterialMeasurement BioMaterialCharacteristic Treatment BioMaterialImp LabelMethod BioSource BioSample LabeledExtract AssayLEX AssayBioMaterial Assay