Download
1 / 91
910 likes | 923 Views
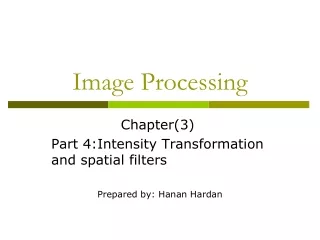
Image Processing. Dr. Karim Q Hussein. Introduction to Computer Vision and Image Processing. Computer imaging can be separated into two primary categories: 1. Computer Vision. 2. Image Processing

E N D
Image Processing Dr. Karim Q Hussein
Introduction to Computer Visionand Image Processing Computer imaging can be separated into two primary categories: 1. Computer Vision. 2. Image Processing In computer vision application the processed images output for use by a computer, whereas in image processing applications the output images are for human consumption).
These two categories are not totally separate and distinct. The boundaries that separate the two are fuzzy, but this definition allows us to explore thedifferences between the two and to explore the difference between the two and to understand how they fit together Computer Vision Image Processing
Computer Vision Computer vision computer imaging where the application doses not involve a human being in visual loop. One of the major topics within this field of computer vision is image analysis. Image Analysis: involves the examination of the image data to facilitate solving vision problem. Computer vision systems are used in many and various types of environments, such as: Manufacturing Systems , Medical Community, DNA analysis, Satellites Orbiting, Infrared Imaging
Image Processing Computer Image processing is computer imaging where application involves a human being in the visual loop. In other words the image are to be examined and a acted upon by people. The major topics within the field of image processing include: Image restoration. Image enhancement. Image compression
Image Restoration Is the process of taking an image with some known, or estimated degradation, and restoring it to its original appearance. Image restoration is often used in the field of photography or publishing where an image was somehow degraded but needs to be improved before it can be printed
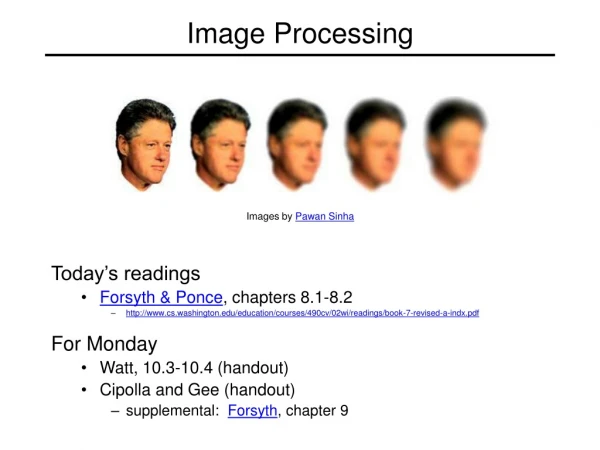
Image Enhancemnet Involves taking an image and improving it visually, typically by taking advantages of human Visual Systems responses. One of the simplest enhancement techniques is to simply stretch the contrast of an image. Enhancement methods tend to be problem specific. For example, a method that is used to enhance satellite images may not suitable for enhancing medical images. Although enhancement and restoration are similar in aim, to make an image look better. They differ in how they approach the problem. Restoration method attempt to model the distortion to the image and reverse the degradation, where enhancement methods use knowledge of the human visual systems responses to improve an image visually.
Image enhancement byb. contrast stretching a. image with poor contrast Image Enhancement
Image Compression Involves reducing the typically massive amount of data needed to represent an image. This done by eliminating data that are visually unnecessary and by taking advantage of the redundancy that is inherent in most images. Image data can be reduced 10 to 50 times, and motion image data (video) can be reduced by factors of 100 or even 200.
a. Image before compression b. Image after compression (92) KB (6.59)KB Image Compression.
Computer Imaging Systems Computer imaging systems are comprised of two primary components types, hardware and software. The hardware components can be divided into image acquiring sub system (computer, scanner, and camera) and display devices (monitor, printer).The software allows us to manipulate the image and perform any desired processing on the image data.
Digitization The process of transforming a standard video signal into digital image .This transformation is necessary because the standard video signal in analog (continuous) form and the computer requires a digitized or sampled version of that continuous signal
What is a digital image? • We usually operate on digital (discrete)images: • Sample the 2D space on a regular grid • Quantize each sample (round to nearest integer) • If our samples are D apart, we can write this as: f[i ,j] = Quantize{ f(iD, jD) } • The image can now be represented as a matrix of integer values
The image can now be accessed as a two-dimension array of data The digital image is 2D- array as: I(0,0) I(0,1) ………………………..I(0,N-1) I(1,0) I(1,1) ………………………..I(1,N-1) …………………………………………………… …………………………………………… I(N-1,0) I(N-1,1) …….……………..I(N-1,N-1) In image matrix, the image size is (NXN) [matrix dimension] then: Ng= 2 m ………..(1) Where Ng denotes the number of gray levels m is the no. of bits contains in digital image matrix. Example :If we have (6 bit) in 128 X 128 image .Find the no. of gray levels to represent it ,then find the no. of bit in this image? Solution: Ng= 26=64 Gray Level Nb= 128 * 128* 6= 9.8304 * 104 bit
The Human Visual System The Human Visual System (HVS) has two primary components: Eye. Brian. * The structure that we know the most about is the image receiving sensors (the human eye). * The brain can be thought as being an information processing unit analogous to the computer in our computer imaging system. These two are connected by the optic nerve, which is really a bundle of nerves that contains the path ways for visual information to travel from the receiving.
Image Resolution The resolution has to do with ability to separate two adjacent pixels as being separate, and then we can say that we can resolve the two. The concept of resolution is closely tied to the concepts of spatial frequency. Spatial frequency concept, frequency refers to how rapidly the signal is changing in space, and the signal has two values for brightness-0 and maximum. If we use this signal for one line (row) of an image and then repeat the line down the entire image, we get an image of vertical stripes. If we increase this frequency the strips get closer and closer together, until they finally blend together
Image brightness Adaption In image we observe many brightness levels and the vision system can adapt to a wide range. If the mean value of the pixels inside the image is around Zero gray level then the brightness is low and the images dark but for mean value near the 255 then the image is light. If fewer gray levels are used, we observe false contours (منحني) bogus lines resulting from gradually changing light intensity not being accurately represented.
Image Representation We have seen that the human visual system (HVS) receives an input image as a collection of spatially distributed light energy; this is form is called an optical image. Optical images are the type we deal with every day –cameras captures them, monitors display them, and we see them [we know that these optical images are represented as video information in the form of analog electrical signals and have seen how these are sampled to generate the digital image I(r , c). The digital image I (r, c) is represented as a two- dimensional array of data, where each pixel value corresponds to the brightness of the image at the point (r, c). in linear algebra terms , a two-dimensional array like our image model I( r, c ) is referred to as a matrix , and one row ( or column) is called a vector
Binary Image Binary images are the simplest type of images and can take on two values, typically black and white, or ‘0’ and ‘1’. A binary image is referred to as a 1 bit/pixel image because it takes only 1 binary digit to represent each pixel. These types of images are most frequently in computer vision application where the only information required for the task is general shapes, or outlines information. For example, to position a robotics gripper to grasp (يمسك) an object or in optical character recognition (OCR). Binary images are often created from gray-scale images via a threshold value is turned white (‘1’), and those below it are turned black (‘0’).
Gray Scale Image Gray _scale images are referred to as monochrome, or one-color image. They contain brightness information only brightness information only, no color information. The number of different brightness level available. The typical image contains 8 bit/ pixel (data, which allows us to have (0-255) different brightness (gray) levels. The 8 bit representation is typically due to the fact that the byte, which corresponds to 8-bit of data, is the standard small unit in the world of digital computer.
Color Image We Color image can be modeled as three band monochrome image data, where each band of the data corresponds to a different color. . The actual information stored in the digital image data is brightness information in each spectral band. When the image is displayed, the corresponding brightness information is displayed on the screen by picture elements that emit light energy corresponding to that particular color.
Multispectral Images Multispectral images typically contain information outside the normal human perceptual range. This may include infrared (تحت الحمراء), ultraviolet (فوق البنفسجيه), X-ray, acoustic or radar data. Source of these types of image include satellite systems underwater sonar systems and medical diagnostics imaging systems.
Overview of Image Properties • An image is composed of an array of dots, more commonly referred to as pixels (short for picture elements). One generally refers to a computer image's dimensions in terms of pixels; this is also often (though slightly imprecisely) known as its resolution. Some common image sizes are 640 × 480, 800 × 600, and 1024 × 768 pixels, which also happen to be common dimensions for computer displays.
In addition to horizontal and vertical dimensions, an image is characterized by depth. The deeper the image, the more colors (or shades of gray) it can have. Pixel depths are measured in bits, the tiniest units of computer storage; - a 1-bit image can represent two colors (often, though not necessarily, black and white). - a 2-bit image four colors. - an 8-bit image 256 colors, and so on.
To calculate the raw size of the image data before any compression takes place, one needs only to know that 8 bits make a byte. • Thus a 320 × 240, 24-bit image has 76,800 pixels, each of which is 3 bytes deep, so its total uncompressed size is 230,400 bytes.
1-bit Images Each pixel is stored as a single bit (0 or 1), so also referred to as binary image. Such an image is also called a 1-bit monochrome image since it contains no color. Next Figure shows a 1-bit monochrome image (called “Lena“ by multimedia scientists - this is a standard image used to illustrate many algorithms).
8-bit Gray-level Images Each pixel has a gray-value between 0 and 255. Each pixel is represented by a single byte; e.g., a dark pixel might have a value of 10, and a bright one might be 230. Bitmap: The two-dimensional array of pixel values that represents the graphics/image data. Image resolution: refers to the number of pixels in a digital image (higher resolution always yields better quality). • Fairly high resolution for such an image might be 1600 * 1200, whereas lower resolution might be 640 *480.
Multimedia Presentation Each pixel is usually stored as a byte (a value between 0 to 255), so a 640 ×480 grayscale image requires 300 kB of storage (640 ×480 = 307,200). NextFig shows the Lena image again, but this time in grayscale.
Dithering • which is a means of mixing pixels of the available colors together to give the appearance of other colors (though generally at the cost of some sharpness) . • When an image is printed, the basic strategy of dithering is used, which trades intensity resolution for spatial resolution to provide ability to print multi-level images on 2-level (1-bit) printers.
An ordered dither consists of turning on the printer output bit for a pixel if the intensity level is greater than the particular matrix element just at that pixel position. NextFig. (a) shows a grayscale image of "Lena". The ordered-dither version is shown as (b), with a detail of Lena's right eye in (c).
Color Image Data Types • The most common data types for graphics and image file formats ; 24-bit color and 8-bit color. • Some formats are restricted to particular hardware/operating system platforms, while others are “cross-platform” formats. • Even if some formats are not cross-platform, there are conversion applications that will recognize and translate formats from one system to another. • Most image formats incorporate some variation of compression technique due to the large storage size of image files. Compression techniques can be classified into either lossless or lossy.
8-bit Color Images Many systems can make use of 8 bits of color information (the so-called “256 colors”) in producing a screen image. Such image files use the concept of a lookup table to store color information. - Basically, the image stores not color, but instead just a set of bytes, each of which is actually an index into a table with 3-byte values that specify the color for a pixel with that lookup table index.
Color Look-up Tables (LUTs) The idea used in 8-bit color images is to store only the index, or code value, for each pixel. Then, e.g., if a pixel stores the value 25, the meaning is to go to row 25 in a color look-up table (LUT).
24-bit Color Images • In a color 24-bit image, each pixel is represented by three bytes, usually representing RGB. - This format supports 256*256*256 possible combined colors, or a total of 16,777,216 possible colors. - However such flexibility does result in a storage penalty: A 640*480 24-bit color image would require 921.6 kB of storage without any compression. • Full-color photographs may contain an almost infinite range of color values. Dithering is the most common means of reducing the color range of images down to the 256 (or fewer) colors seen in 8-bit GIF images.
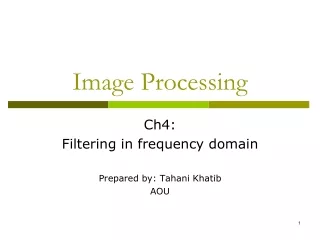
Chapter Two Image Analysis
Image Analysis Image analysis involves manipulating the image data to determine exactly the information necessary to help solve a computer imaging problem. This analysis is typically part of a larger process, is iterative in nature and allows us to answer application specific equations: Do we need color information? Do we need to transform the image data into the frequency domain? Do we need to segment the image to find object information? What are the important features of the image? Image analysis is primarily data reduction process. As we have seen, images contain enormous amount of data, typically on the order hundreds of kilobytes or even megabytes. Often much of this information is not necessary to solve a specific computer imaging problem, so primary part of the image analysis task is to determine exactly what information is necessary. Image analysis is used both computer vision and image processing. But it is different.
System Model The image analysis process can be broken down into three primary stages: 1- Preprocessing. 2- Data Reduction. 3- Features Analysis. Preprocessing: Is used to remove noise and eliminate irrelevant, visually unnecessary information. Noise is unwanted information that can result from the image acquisition process, other preprocessing steps might include: -Gray –level or spatial quantization (reducing the number of bits per pixel or the image size). -Finding regions of interest for further processing.
Data Reduction Involves either reducing the data in the spatial domain or transforming it into another domain called the frequency domain, and then extraction features for the analysis process.
Features Analysis The features extracted by the data reduction process are examine and evaluated for their use in the application. After preprocessing we can perform segmentation on the image in the spatial domain or convert it into the frequency domain via a mathematical transform. After these processes we may choose to filter the image. This filtering process further reduces the data and allows us to extract the feature that we may require for analysis.
Preprocessing preprocessing algorithm, techniques and operators are use to perform initial processing that makes the primary data reduction and analysis task easier. They include operations related to: -Extracting regions of interest. -Performing basic algebraic operation on image. -Enhancing specific image features. -Reducing data in resolution and brightness. Preprocessing is a stage where the requirements are typically obvious and simple, such as removal of artifacts from images or eliminating of image information that is not required for the application. For example, in one application we needed to eliminate borders from the images that have been digitized from film. Another example of preprocessing step involves a robotics gripper that needs to pick and place an object ; for this we reduce a gray-level image to binary (two-valued) image that contains all the information necessary to discern the object ‘s outlines.
Region –of-Interest Image Geometry Often, for image analysis we want to investigate more closely a specific area within the image, called region of interest (ROI). To do this we need operation that modifies the spatial coordinates of the image, and these are categorized as image geometry operations. The image geometry operations discussed here include: Crop (بروز ) , Zoom, enlarge , shrink, translate and rotate. The image crop process is the process of selecting a small portion of the image, a sub image and cutting it away from the rest of the image. After we have cropped a sub image from the original image we can zoom in on it by enlarge it. The zoom process can be done in numerous ways: 1- Zero-Order Hold. 2- First _Order Hold. 3- Convolution.
Zero-Order hold is performed by repeating previous pixel values, thus creating a blocky effect as in the following figure:
First _Order Hold is performed by finding linear interpolation between a adjacent pixels, i.e., finding the average value between two pixels and use that as the pixel value between those two, we can do this for the rows first as follows