Download

1 / 18
180 likes | 354 Views
Multi-Screen Insights. Usage Across All Screens. Multi-Screen Insights. Consumers spend 93% of their total video time with TV (P2+); 86% among A18-24 Mobile video is on the rise but comprises a nominal share of total video – 4% Time spent with gaming consoles is relatively flat

E N D
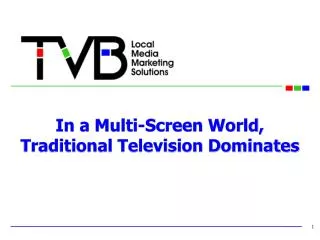
Multi-Screen Insights Usage Across All Screens
Multi-Screen Insights Consumers spend 93% of their total video time with TV (P2+); 86% among A18-24 Mobile video is on the rise but comprises a nominal share of total video – 4% Time spent with gaming consoles is relatively flat Television is still king among young and old; across all ethnic segments African-Americans watch a lot more television than any other segment Mobile video usage has grown across all ethnic segments but declined among Asians
Consumers Spend 93% of Their Total Video Time With TV…146+ Hours A Month Monthly Video Consumption by Device Watching Television Watching Video on a Computer Watching Video on a Mobile Phone 283 Million 150 Million 51 Million # of Viewers Time Spent (hrs:min) 146:37 6:28 5:45 93% Of Overall Video Time Source: Nielsen Cross Platform Report 2Q13; P2+
Among Young Adults and Teens, Television Consumes Over 85% Of Total Video Time Monthly Video Consumption by Device Watching Television Watching Video on a Mobile Phone Watching Video on a Computer % of Overall Video Time # of Viewers P2+ 146:37 93% 6:28 5:45 P18-24 105:58 86% 11:20 6:07 P 12-17 94:51 88% 4:08 8:42 Source: Nielsen Cross Platform Report 2Q13
Mobility Of Content & Information Has Grown But Still Only Comprises A Nominal Share Of TotalVideo Time Monthly Video Consumption by Device Watching Video on a Computer Watching Video on a Mobile Phone P2+ P18-24 P2+ P18-24 Time Spent 6:28 11:20 5:45 6:07 % Change v. YAG +14% +8% +5% +10% Share Of Total Video Time 4% 9% 3% 5% Source: Nielsen Cross Platform Report, P2+; 2Q13
Time Spent With Gaming Consoles Has Remained Relatively Flat Across The Board Monthly Time Spent With Gaming Console Time Spent (hours: minutes) v. YAG P2+ 6:27 0% T12-17 16:10 0% A18-24 13:59 +2% A25-34 9:15 -1% Source: Nielsen Cross Platform Report, P2+; 2Q13
Video Consumption Is Additive As Viewing Grows Throughout The Day Across All Screens Monthly Video Consumption by Device Watching Television Watching Video on a Computer Watching Video on a Mobile Phone Time Spent (hours: minutes) 146:37 6:28 5:45 +1% v. YAG +14% v. YAG +5% v. YAG Source: Nielsen Cross Platform Report, P2+; 2Q13
TV Is Still The King Among Young And Old Weekly Time Spent in Hours: Minutes K2-11 T12-17 A18-24 A25-34 A35-49 A50-64 A65+ P2+ Watching Traditional Television 23:18 20:39 21:32 26:18 31:16 40:51 46:54 31:47 Watching Video on Internet 0:11 0:19 1:24 1:21 0:57 0:45 0:16 0:45 Mobile Subscribers Watching Video on a Mobile Phone - 0:34 0:30 0:27 0:14 0:05 0:15 0:01 Source: Nielsen Cross Platform Report, P2+; 1Q13
Among The Young, TV Is Top Choice For Entertainment & Information Weekly Time Spent in Hours: Minutes K2-11 T12-17 A18-24 Watching Traditional Television* 20:39 21:32 26:18 Watching Time-shifted Television 1:34 1:39 3:04 0:51 4:58 6:17 Using the Internet Watching Video on Internet 0:19 1:24 1:21 Mobile Subscribers Watching Video on a Mobile Phone 0:34 0:30 0:27 Source: Nielsen Cross Platform Report, P2+; 2Q13; * includes time-shifted time; **in all TV homes
Television Is The Dominant Viewing Screen Across All Ethnic Segments; Over 90% Of Time Spent Is With TV Monthly Time Spent (P2+) in Hours: Minutes African-American White Hispanic Asian 146:37 206:47 121:28 86:37 Watching Traditional Television* Share Of Total Video Time 93% 93% 90% 83% 12:35 9:23 8:45 9:00 Watching Time-shifted Television** 6:28 9:00 8:17 12:23 Watching Video on Internet Mobile Subscribers Watching Video on a Mobile Phone 5:45 6:53 5:59 5:41 Source: Nielsen Cross Platform Report, P2+; 2Q13 * includes time-shifted time; **in all TV homes
African-Americans Consume A Large Amount Of Video Monthly Time Spent (P2+) in Hours: Minutes African-American White Hispanic Asian 146:37 206:47 121:28 86:37 Watching Traditional Television* 12:35 9:23 8:45 9:00 Watching Time-shifted Television** 6:28 9:00 8:17 12:23 Watching Video on Internet Mobile Subscribers Watching Video on a Mobile Phone 5:45 6:53 5:59 5:41 Source: Nielsen Cross Platform Report, P2+; 2Q13 * includes time-shifted time; **in all TV homes
Time Spent With Mobile Video Grew Across All Segments Except Asian Monthly Time Spent (P2+) in Hours: Minutes African-American White Hispanic Asian 146:37 206:47 121:28 86:37 Watching Traditional Television* Watching Video on Internet 6:28 9:00 8:17 12:23 Mobile Subscribers Watching Video on a Mobile Phone 5:45 6:53 5:59 5:41 +5% +20% +4% -16% Source: Nielsen Cross Platform Report, P2+; 2Q13 * includes time-shifted time; **in all TV homes
Multi-TechnologyHomes Are Increasingly Acquiring Various Devices
High Definition TV and Tablet Penetration Is On The Rise Devices in TV HHs (in OOOs) Composite v. YAG DVD/Blue-ray Player 94,587 -2% DVR 52,977 +8% High Definition TV 93,514 +8% Video Game Console 50,250 -3% Tablet 27,049 +85%