Download
1 / 44
440 likes | 575 Views
Effect of solar terms to q 23 determination in Super-Kamiokande and important systematic errors for future improvements. Shoei NAKAYAMA (ICRR) for Super-Kamiokande Collaboration December 9, 2004 @ RCCN International Workshop. 1. Motivation.

E N D
Effect of solar terms toq23 determination in Super-Kamiokandeandimportant systematic errorsfor future improvements Shoei NAKAYAMA (ICRR) for Super-Kamiokande Collaboration December 9, 2004 @ RCCN International Workshop
1. Motivation • There is no evidence for atmospheric ne oscillation. sin2 q13 is consistent with 0 in the present 3 flavor analysis. (Dm223, sin2 q23, sin2 q13) • After solar n and KamLAND results, we can say that oscillation of low energy ne should appear at some level even if sin2 q13 = 0. (sub-leading oscillations driven by Dm212) • We perform an oscillation analysis taking into account solar parameters (Dm212, sin2 2q12) and study their effects. especially in determination of sin2 q23
The analyses in my talk choose sin2 q13 = 0 Dm212 = 8.3 x 10 -5 eV2 sin2 2q12 = 0.83 ( tan2 q12 = 0.41 ) from KamLAND (@ NEUTRINO2004)
Oscillation effects in e-like events Fosce = F0e P(ne ne) + F0m P(nm ne) F0e ,F0m : n flux w/o osc. = F0e [ P(ne ne) + r P(nm ne) ] r = F0m/ F0e : m/e flux ratio = F0e [ 1 – P2 + r cos2 q23 P2 ] P2 = |Aem|2 : 2n transition probability ne nmt in matter driven by Dm212 (Fosce / F0e) – 1 = P2 (r cos2 q23 – 1) screening factor for low energy n (r ~ 2) ~ 0 if cos2 q23 = 0.5 (sin2 q23 = 0.5) < 0 if cos2 q23 < 0.5 (sin2 q23 > 0.5) > 0 if cos2 q23 > 0.5 (sin2 q23 < 0.5)
cosq = - 0.6 En = 500 MeV P(ne ne) P(nm ne) Dm212 = 8.3 x 10⁻⁵ eV2 sin2 2q12 = 0.82 , sin2 q13 = 0 , sin2 q23 = 0.5
P(nm ne) solar : on sin2 q13 = 0 sin2 q23 = 0.5 w/o matter effect
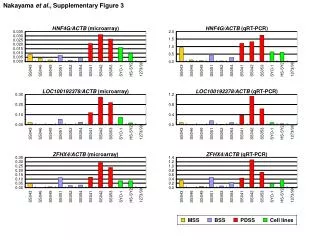
sub-GeV e-like zenith angle X : zenith angle Y : N_e (3 flavor) / N_e (2 flavor full-mixing) sub-GeV e-like (Pe :100 ~ 1330 MeV) (Pe :100 ~ 400 MeV) (Pe :400 ~ 1330 MeV) Dm212 = 8.3 x 10⁻⁵ eV2 Dm223 = 2.5 x 10⁻³ eV2 sin2 2q12 = 0.82 sin2 q23 = 0.4 sin2 q23 = 0.5 sin2 q23 = 0.6
Lepton scattering angle as a function of momentum Low energy leptons have weak angular correlation to the parent n direction.
sub-GeV e-like momentum X : electron momentum (MeV/c) Y : N_e (3 flavor) / N_e (2 flavor full-mixing) sub-GeV e-like Dm212 = 8.3 x 10⁻⁵ eV2 Dm223 = 2.5 x 10⁻³ eV2 sin2 2q12 = 0.82 sin2 q23 = 0.4 sin2 q23 = 0.5 sin2 q23 = 0.6
sub-GeV m-like zenith angle X : zenith angle Y : N_m (3 flavor) / N_m (2 flavor full-mixing) sub-GeV m-like (Pm : 200 ~ 1330 MeV) (Pm : 200 ~ 400 MeV) (Pm : 400 ~ 1330 MeV) sin2 q23 = 0.4 sin2 q23 = 0.5 sin2 q23 = 0.6 2 flavor (sin2 2q23 = 0.96) Dm212 = 8.3 x 10⁻⁵ eV2 Dm223 = 2.5 x 10⁻³ eV2 sin2 2q12 = 0.82
sub-GeV m/e ratio (zenith angle dependence) X : zenith angle Y : Rme (3 flavor) / Rme (2 flavor full-mixing) sub-GeV Pm , e < 400 MeV Pm , e > 400 MeV sin2 q23 = 0.4 sin2 q23 = 0.5 sin2 q23 = 0.6 2 flavor (sin2 2q23 = 0.96) Dm212 = 8.3 x 10⁻⁵ eV2 Dm223 = 2.5 x 10⁻³ eV2 sin2 2q12 = 0.82
Oscillation analysis with SK-I data • Data set and analysis tools : same as the current standard 3 flavor analysis. • Oscillation maps : Dm212 = 8.3 x 10⁻⁵ eV2 sin2 2q12 = 0.82 sin2q13 = 0 Dm223 = 10-3.2 ~ 10-2 eV2 sin2q23 = 0 ~ 1 2 dimensional analysis • Find a c2min point : projection to the sin2 q23 axis deviation from the 2-3 full mixing ? fixed values from KamLAND fixed value same as the standard analysis
Result c2 distribution as a function of sin2 q23 where Dm223 is chosen to minimize c2
What kind of systematic errors are importantfor future sin2 q23 determination ? • 44 systematic error parameters in the current standard 3 flavor analysis tools. • Test with 20yr oscillated MC instead of observed data. (sin2 q23 = 0.4, 0.45, 0.55, 0.6 and Dm223 = 2.5 x 10⁻³ eV2) • Reduce each systematic error one by one down to ¼ of original
c2 distribution with reduced systematic errors true : sin2 q23 = 0.4 Reducing n interaction related systematic errors is most important to distinguish sin2 q23 = 0.4 from sin2 q23 = 0.6. Flux errors also give big effects.
c2 contribution from sub-samples no change in systematic errors all systematic errors 1/4 Sub-GeV samples play an important role in determination of the sign of the sin2 q23 deviation. (in case of sin2 q13 = 0)
c2 distribution for various true sin2 q23 true : sin2 q23 = 0.55 true : sin2 q23 = 0.45 true : sin2 q23 = 0.6
Which systematic error should be reduced ? (1) Flux sys. errors Flux sys. errors
Which systematic error should be reduced ? (2) Flux, n interaction sys. errors n interaction sys. errors
Which systematic error should be reduced ? (3) n interaction sys. errors SK related sys. errors
Which systematic error should be reduced ? (4) SK related sys. errors
Systematic uncertainties in n flux ratios flavor ratio anti-n / n ratios 3 % error for En < 5 GeV 5 % error for En < 10 GeV
Systematic uncertainties in flux up/down ratio P<400MeV/c e-like 0.5% P<400MeV/c m-like 0.8% P>400MeV/c e-like 2.1% P>400MeV/c m-like 1.8%
Systematic uncertainties in MAfor QE and single-p production models Sub-GeV single-ring e-like (Pe<400MeV/c) Sub-GeV single-ring e-like (Pe>400MeV/c) MA = 1.11 MA = 1.01 MA = 1.11 MA = 1.01 R(MA=1.01/MA=1.11) R(MA=1.01/MA=1.11) lepton scattering angle lepton scattering angle
Systematic uncertainties in nuclear effectsin QE cross section calculation ne ne QE cross section Neut relativistic Fermi gas model with flat momentum dist. Singh and Oset’s model nm nm
Other important systematic errors • primary cosmic ray energy spectral index 0.05 uncertainty ( >100GeV ) • NC/CC cross section ratio +- 20 % • Nuclear effect in 16O (absorption, charge exchange, inelastic scattering) +- 30 % • Hadron simulation difference between CALOR and FLUKA • Energy calibration for FC events +- 2 % 100GeV
Reduce 7 dominant systematic errors at once true : sin2 q23 = 0.4 true : sin2 q23 = 0.45 ½ ¼ ½ ¼ MA in QE, single-p QE cross section model NC / CC nm / ne anti-ne / ne , anti-nm / nm flux up / down
Summary • Effects of solar n oscillation parameters on atmospheric n oscillations have been studied. • Future atmospheric n oscillation analysis with 1-2 parameters might provide unique information on the sign of the sin2 q23 deviation (if exists). • It’s important to reduce systematic uncertainties on interaction models and flux calculations for low energy (Sub-GeV) neutrinos.
P2 Smirnov Dm212 = 7.3 x 10⁻⁵ eV2 sin2 2q12 = 0.82
sub-GeV m/e ratio (zenith angle dependence) contd. Sub-GeV (Pm,e < 400 MeV/c) Sub-GeV (Pm,e > 400 MeV/c)
Systematic errors in flux calculations (Up/down asymmetry) Compare Honda2003 flux to Fluka2003 and Bartol2003 flux calculations. Take the difference to be the systematic errors. Predictions of up/down ratio Honda Fluka Bartol difference P<400MeV/c e-like 1.018 1.027 1.024 -0.5% (fluka) P<400MeV/c m-like 1.030 1.047 1.038 -0.8% (fluka) P>400MeV/c e-like 1.051 1.096 1.059 -2.1% (fluka) P>400MeV/c m-like 1.040 1.079 1.051 -1.8% (fluka) Multi-GeV e-like 0.997 1.028 0.990 -1.5% (fluka) Multi-GeV m-like 1.003 1.019 1.019 -0.8% (bartol,fluka) PC 0.995 1.005 0.990 -0.5% (fluka) Sub-GeV multi-ring m-like 1.005 1.022 1.008 -0.8% (fluka) Multi-GeV multi-ring m-like 0.994 1.008 0.990 -0.7% (fluka)
Systematic uncertainties inK/p ratio in flux calculation Up-stop Up-stop Up-through Fraction of neutrinos produced from K Produced from p Up-through Produced from K Change the fraction of K by 20% Systematic error
Neutrino flux produced by primary cosmic ray with > 1, 10, 100 1000 GeV Systematic uncertainty in primary cosmic ray energy spectrum index nm Estimate the difference of neutrino flux caused by the Ed (>100GeV) in primary spectrum Note: for <100GeV energy spectrum of primary cosmic ray has been measured accurately by BESS and AMS nm ne Systematic uncertainty ne 100GeV Systematic uncertainty
Systematic uncertainties in MA for QE and single-p production(angular difference between neutrino and outgoing lepton) Reconstructed m (e) Dq MA=1.01 / MA=1.11 (q2 correction) n e-like - 251MeV e-like 251 - 400MeV e-like 400 - 630MeV e-like 630 - 1000MeV e-like 1000MeV - m-like 251 - 400MeV m-like 1000MeV - m-like 630 - 1000MeV m-like - 251MeV m-like 400 - 630MeV
Systematic uncertainties in nuclear effectsin QE cross section calculation ne ne s(QE)Singh / s(QE)Neut Neut relativistic Fermi gas model with flat momentum dist. independent Singh and Oset’s model nm nm
A different point fromthe current standard 3 flavor analysis • Our standard 3 flavor analysis uses an averaging method for the last propagation in mantle. • At the present moment, this analysis does not use this averaging method. The 20-neutrino-energies method are used for all MC events.
Averaged probability in 3-flavor oscillation • Simple in 2-flavor case, but not in 3-flavor case • 2-flavor vacuum oscillation : 1-sin22qsin2(Dm2E/L) → 1-1/2·sin22q • due to matter effect and multi-layer density in the earth, oscillation probability is very difficult to be solved analytically • We derived averaged transition matrix by following relation: • We applied average method for last propagation in the mantle. In the core layers, there is known enhancement by combination of multiple core layers and we don’t take average in the core region. Lmantle Lmantle n
Probability calculation • neutrino production height in the atmosphere • updated production height distribution based on HONDA3D calculation • 20 probability calculations using 20 neutrino production height, and then take average of the probabilities. • recycle MC events to effectively increase MC statistics • for each MC event, select 20 MC events with same event type which observed energy is closest to that of original MC event. • use 1(original)+20(closest) neutrino energy in calculations of oscillation probability for the original MC event.